How Technology Hits Our Local Bank Branches

(Source: Author’s calculation based on FDIC BankFind Suite: Summary of Deposits survey data)
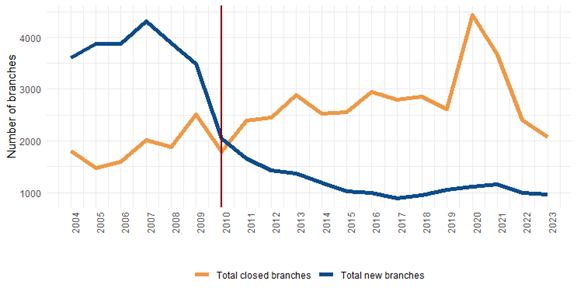
Figure 2 shows branch openings (blue line) and closures (orange line) from 2004 to 2023. Before 2010, openings consistently outpaced closures, resulting in net branch growth. After the Global Financial Crisis, the pattern reversed: closures exceeded openings every year from 2010 onward. The COVID-19 pandemic accelerated the process, with closures spiking to more than 4,000 in 2020 alone.
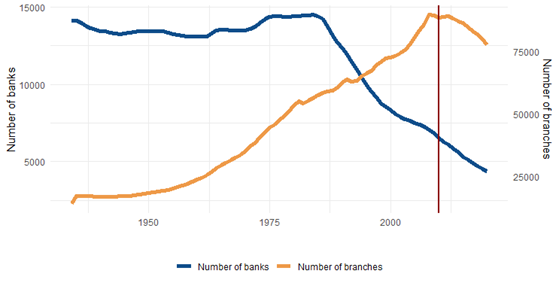
This shows that the net decline in branch counts that we saw in Figure 1 reflects both slower new branch openings and a spike of branch closures.
Depositor Behavior and Branch Profitability
Why do some branches close while others remain? A branch is more likely to stay open if it is profitable. A key factor in branch profitability is how its customers respond to changes in interest rates.
Banks are more likely to close branches in areas where depositors actively shop around for the best rates. Why? Because when these banks offer low interest rates on deposits, they lose customers. Their rate-sensitive customers also tend to be more comfortable with digital banking. They place less value on having a physical branch nearby, making closures less risky for banks.
Interestingly, when opening new branches, banks follow a different logic - they're more likely to open branches in areas with rate-sensitive depositors. This is because they can attract these customers by offering competitive rates.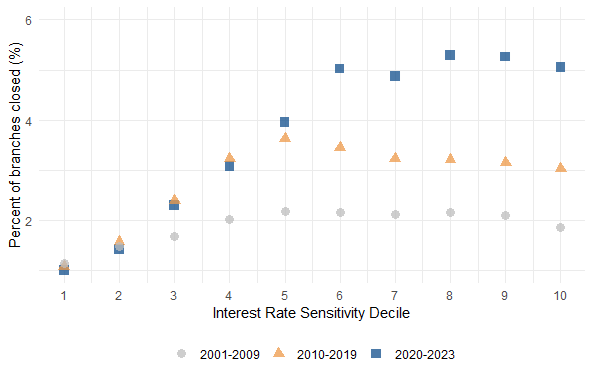
Our analysis shows us that depositor behavior, driven by technology adoption, significantly influences branch closures. Younger, more educated, and financially sophisticated households quickly adopt mobile banking. They are more interest-rate sensitive as they can easily move their deposits to better-rate options. Additionally, they rely less on in-person branch visits. This contributes to branch closures as banks adapt to changing customer preferences.
The Role of the Pandemic
The COVID-19 pandemic accelerated these patterns. We analyzed cell phone data on branch traffic to understand the relationship between depositor behavior and branch visits. Just as many people were staying home during the pandemic, the data show steep drops in branch visits between 2019 and 2021. Declines were even greater in areas with financially sophisticated populations. When mobile and online banking became more common, many depositors realized they didn’t need to bank locally. With fewer in-person customers, branch closures spiked, especially at large banks which are better at providing banking services online.
Implications
The evidence suggests that deposit profitability—influenced by rate sensitivity and technology adoption—is the primary driver of modern branch restructuring. This is an important new finding because traditionally, lending has been considered a key factor for branches. Geographic proximity historically was important for building relationships and assessing creditworthiness. However, in today's digital age, lending plays a minimal role in branch decisions.
The decline of branches has two main implications. First, as physical branches become less common, we're seeing fewer obstacles to efficient banking. When banks aren't limited by their physical location, money can flow more freely between different areas, leading to more competitive rates and better financial services overall. Second, communities face uneven impacts: areas with more sophisticated households are shedding branches faster, while those with less-mobile depositors retain them.
The U.S. has thus entered a new phase of banking restructuring. The long era of branch expansion, enabled by deregulation which led to merger-and-acquisition activity in the 1980s and 1990s, has ended. It gave way to branch contraction driven by technology and depositor behavior. If international experience is a guide—Scandinavian countries have seen reductions of up to 90% in branch counts—further declines in the U.S. are likely.1