Reserve Demand Estimation: A Proposal
Economic Brief
April 2026, No. 26-13
Key Takeaways
- Monetary policy implementation can be framed in terms of the demand for reserves: the relationship between the quantity of reserves held at the Fed and the average rate at which banks trade in interbank markets.
- We propose a new econometric strategy to estimate the demand for reserves, which incorporates core restriction derived from theory models yet remains flexible and easy to implement.
- We compare our estimates of the demand for reserves with other available approaches.
Monetary policy involves two steps: The first is to choose a target for the policy rate, and the second is to implement it. The target is typically stated as a range for the interest rate at which banks borrow and lend in interbank markets, and it is chosen based on macroeconomic variables, such as inflation and labor market conditions. The implementation step consists of creating conditions in interbank markets consistent with that target.
In the U.S., the Federal Open Market Committee (FOMC) sets its policy target in terms of the effective federal funds rate (EFFR), the volume-weighted average rate at which banks trade reserve balances in the federal funds market. The FOMC also specifies the instruments to be used to achieve that target. For example, after its December 2025 meeting, the FOMC instructed the New York Fed's Open Market Trading Desk to "undertake open market operations as necessary to maintain the federal funds rate in a target range of 3-1/2 to 3-3/4 percent."
In this article, we review recent research on the implementation of monetary policy. We focus on the U.S., although many of the lessons apply more broadly. The U.S. is a useful case because its operating framework has changed substantially in recent decades. These changes include a large increase in reserves and the use of administered rates, such as interest on reserve (IOR) balances and the discount window rate (DWR). As we explain below — drawing from our 2026 working paper "Reserve Demand Estimation with Minimal Theory" — these changes make empirical work more relevant, but also more challenging.
Demand for Reserves: A Stylized Framework and Theory-Based Restrictions
Monetary policy implementation can be framed in terms of the demand for reserves: the relationship between the quantity of reserves held at the Fed and the average rate at which banks trade in interbank markets. Figure 1 shows a stylized example of this relationship.1
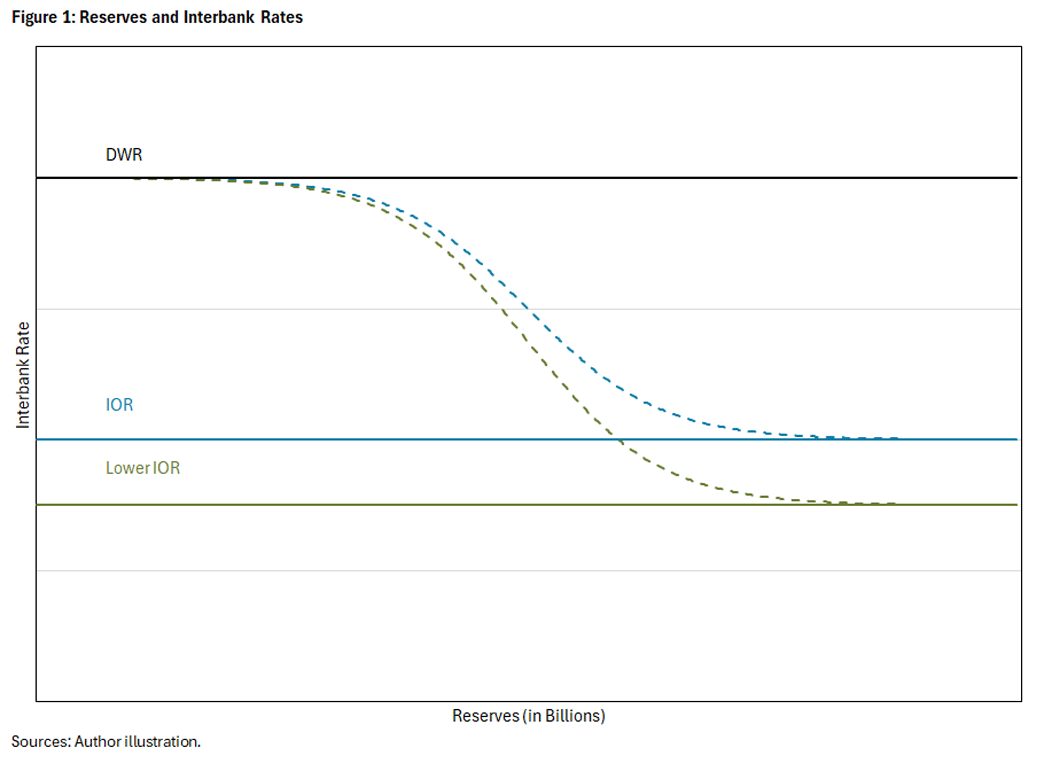
The demand for reserves is typically downward sloping: When reserves are more abundant, banks are more likely to borrow at lower rates. By choosing the supply of reserves, the Fed can influence the interbank rate. For this reason, knowledge of the demand for reserves is central to monetary policy implementation.
Most theories of the demand for reserves share two core implications. First, the demand for reserves has a logistic shape with what is essentially a lower and an upper boundary. The lower boundary is the interest rate the Fed pays on reserves (IOR in Figure 1). That is, no bank would be willing to lend at a lower rate than what it can earn by keeping reserves at the Fed. Similarly, the upper boundary is the rate at which banks can borrow from the Fed through the discount window (DWR in Figure 1). No bank would be willing to borrow in the interbank market at a rate above that.2
Second, the position of the demand for reserves depends on administered rates. Administered rates — such as the IOR and the DWR — are part of the Fed's policy toolkit. Theory implies that the demand for reserves shifts when these rates change. For example, if the IOR falls, the return from holding reserves at the Fed also falls. That tends to put downward pressure on rates in the interbank market, as shown in the green line of Figure 1. Similarly, an increase in the DWR tends to raise the upper part of the reserve demand curve.
These two minimal theoretical implications can serve as useful restrictions for empirical work. We'll soon discuss existing empirical approaches and ask whether they are consistent with these minimal theory-based restrictions. Before that, though, we take a quick look at the data.
Can You Spot a Demand?
Figure 2 shows the raw data used in the reserve demand estimation. The x-axis shows the quantity of reserves at the Fed, and the y-axis shows the EFFR. We express the EFFR as a spread over the IOR (as is common in empirical work) to control for changes in the level of the IOR. The data are weekly and cover the period Jan. 1, 2010, to June 24, 2025.3
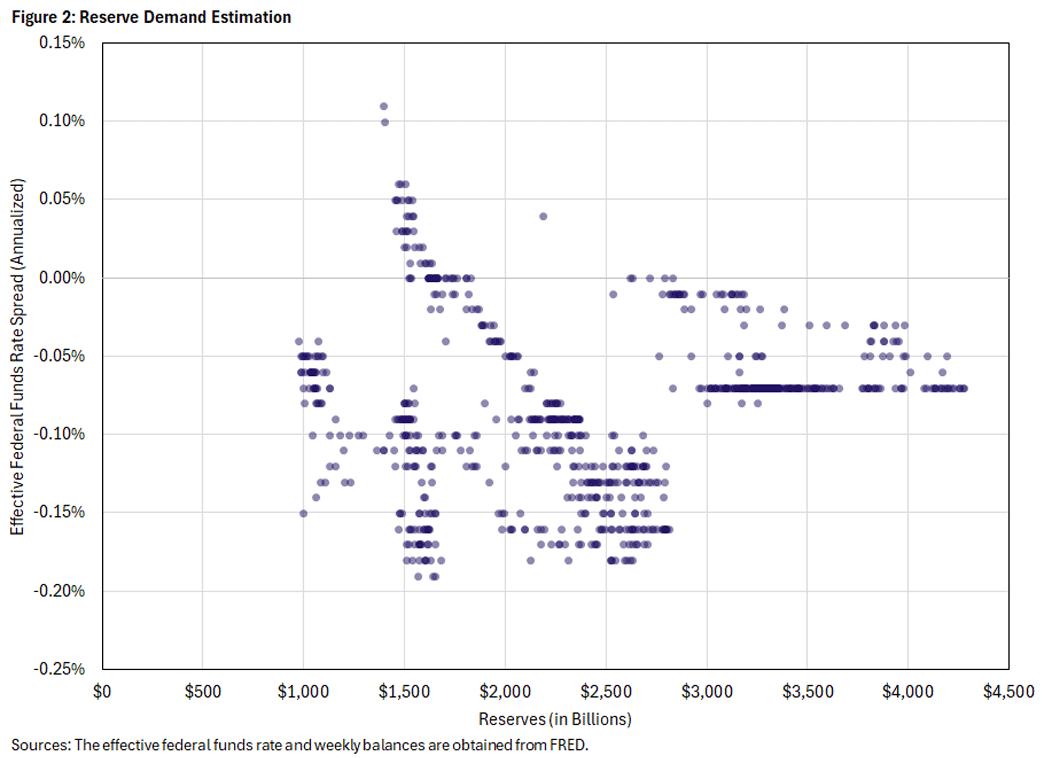
It is difficult to visually identify a demand curve in the raw data. Some parts of the data suggest a downward-sloping pattern, while others look flatter, with no clear overall relationship. Estimating reserve demand from these raw data is challenging.
We can make progress by bringing in one basic insight from theory: Reserve demand depends on administered rates. Figure 3 shows the same data, but now colors the observations by the spread between the DWR and the IOR. It also separates periods with different regulatory environments:
- Jan. 1, 2010, to Dec. 31, 2016, when regulation was still changing
- Sept. 13, 2019, to June 24, 2025, when the Fed’s operating framework was affected by the September 2019 money-market stress and later on by COVID-related developments
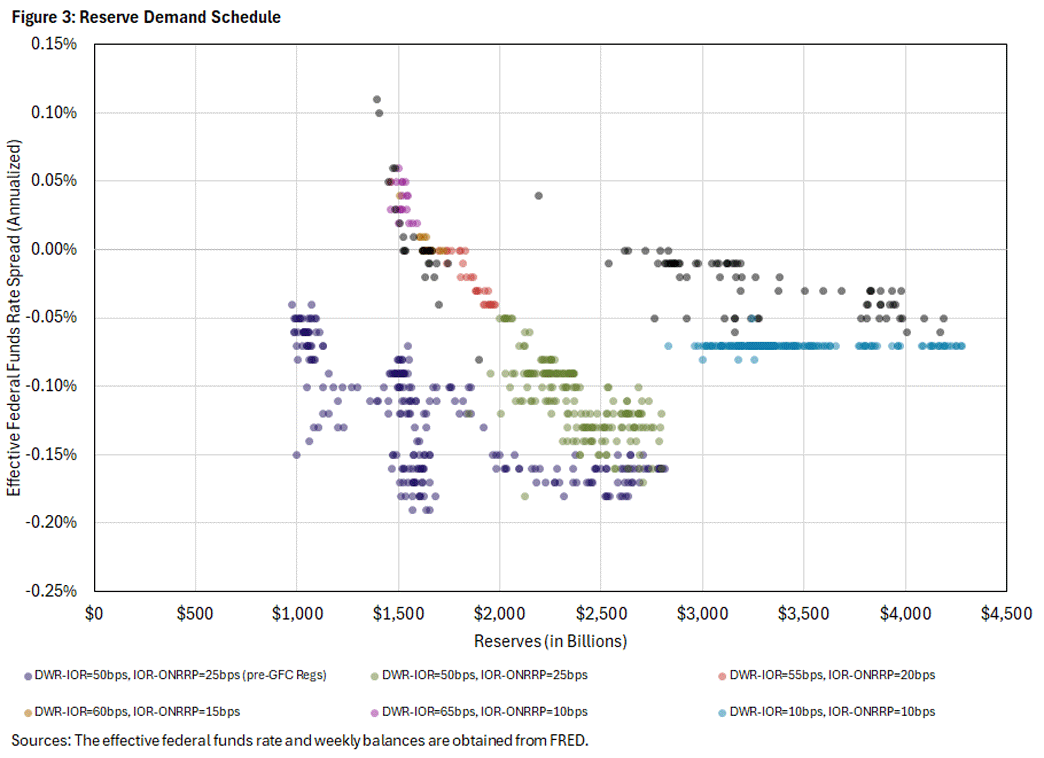
After these adjustments, a clearer demand for reserves seems to emerge. It is easier to see a reserve demand once we account for the elementary theoretical insight that it is not reasonable to treat all the observations as lying on a single reserve demand schedule. The data appear consistent with that view.
Estimation of Demand for Reserves: Current Approaches
There are currently two approaches to estimating the demand for reserves:
- A no-theory approach, which uses statistical methods unrestricted by economic theory4
- A quantitative-theoretic structural approach — which we propose in our 2023 working paper "Monetary Policy Operations: Theory, Evidence and Tools for Quantitative Analysis" — that uses a fully specified equilibrium model of interbank-rate determination to estimate the demand for reserves
The no-theory approach is appealing for its simplicity, but it faces two empirical challenges. First, the most common specifications have poor extrapolation properties. As we discuss below, two different functional forms can fit the data equally well locally but have very different predictions outside out of sample.
Second, no-theory approaches cannot be used to study counterfactual policy changes because the estimated relationship holds only under the observed policy. For example, no-theory approaches are not well suited to evaluate the effects of changing the distance between the IOR and the DWR, a policy change the Fed has implemented several times over the past decade. These challenges limit the range of policy questions that the no-theory approach can address.
In contrast, the quantitative-theoretic structural approach can be used for policy evaluation, and the global shape of the demand for reserves is identified by microeconomic fundamentals, such as preferences and technology. The structural approach, however, can be computationally demanding for everyday use by practitioners.
In our 2026 working paper, we propose a new strategy to estimate demand for reserves: a middle ground between the no-theory approach and the quantitative-theoretic structural approach. It consists of a simple econometric specification that satisfies the two core restrictions discussed above. The resulting approach is as user friendly as no-theory reduced-form methods, while imposing a minimal set of theory-based restrictions. We refer to it as the minimal-theory approach.
Next, we discuss reserve demand estimation under the no-theory approach and our minimal-theory approach. Based on the data discussion above, we focus on the period Jan. 1, 2017, to Sept. 13, 2019, when administered rates changed but the regulatory environment was largely unchanged.
Estimation of Demand for Reserves: The No-Theory Approach
The no-theory empirical approach often uses one of two specifications to estimate reserve demand: a logarithmic or a logistic functional form.5 Both are reasonable choices, as the logarithmic form captures a semi-elasticity, while the logistic form allows for a global shape of the demand schedule that is closer to what theory predicts. Figure 4a shows the fit of the logarithmic form, while Figure 4b shows the fit of the logistic form. Consistent with the previous discussion, we allow the estimates to vary with the level of administered rates.
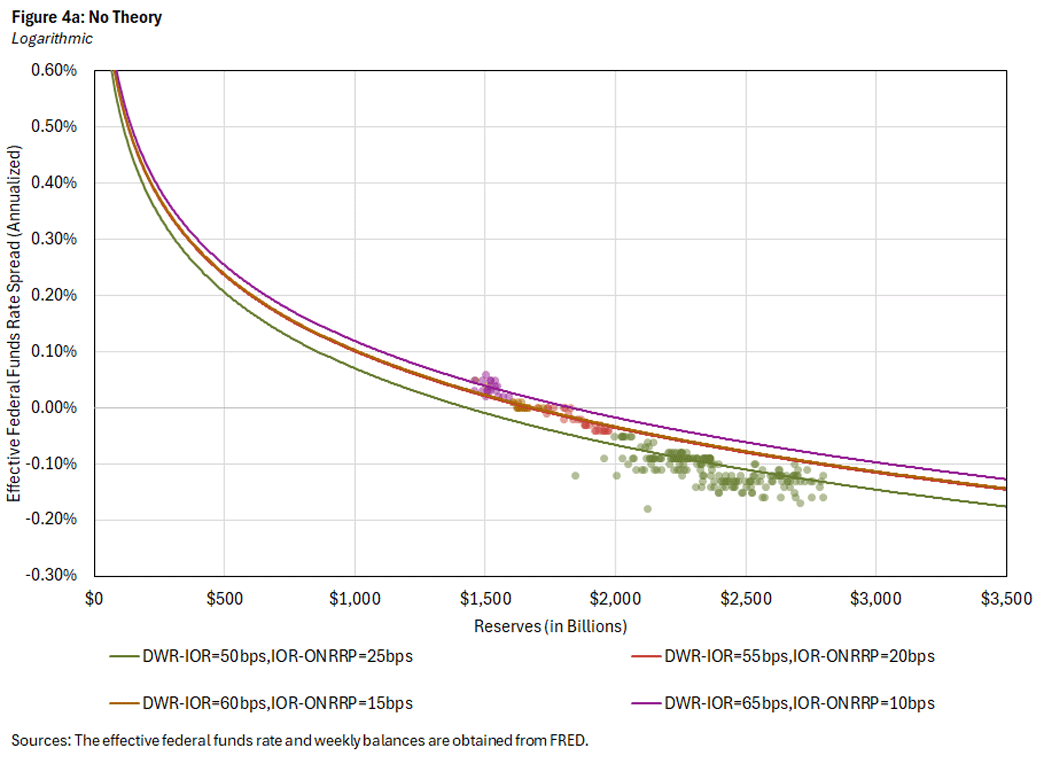
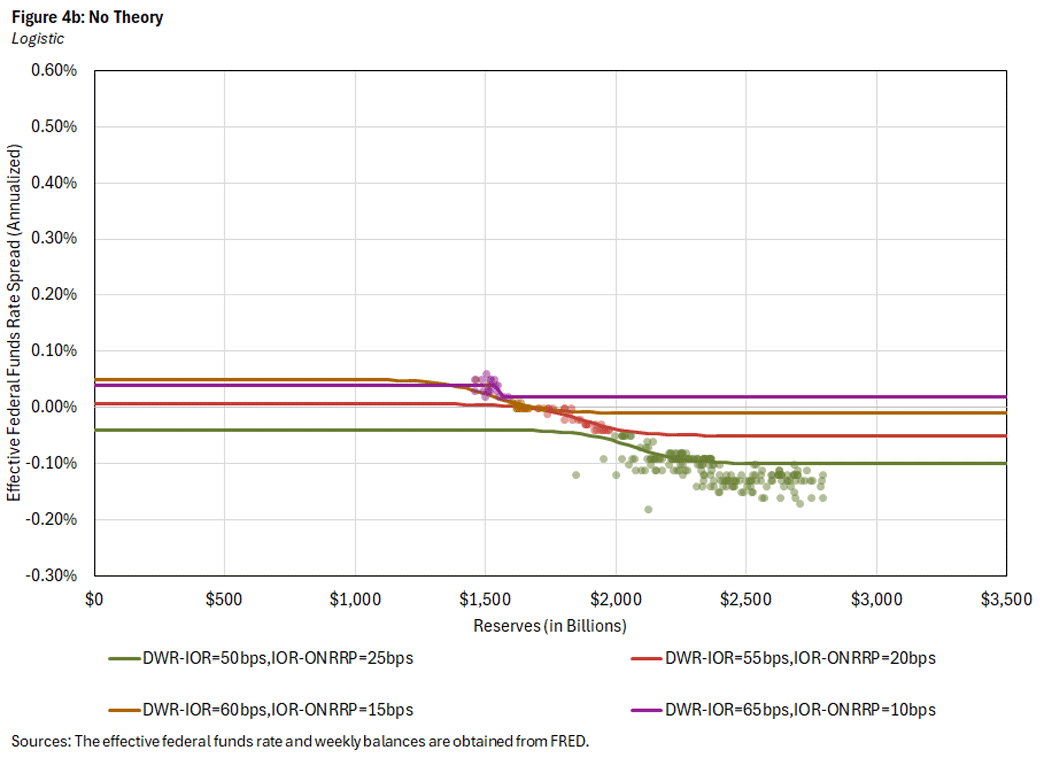
Figure 4 illustrates a key empirical challenge of the no-theory approach: extrapolation. Both functional forms fit the data almost equally well, so it is hard to choose between them based on in-sample fit.
However, their out-of-sample predictions are very different. The logarithmic fit implies that the interbank rate rises quickly as reserves decline and keeps falling as reserves increase. The logistic fit, by contrast, implies a much flatter relationship, with only small differences in rates whether reserves approach zero or $3 trillion. This gap between two reasonable functional forms limits the usefulness of the no-theory approach for guiding monetary policy implementation in a floor system.
The no-theory approach also fails to capture the lower and upper boundaries implied by theory. Next, we show how to incorporate these minimal theoretical insights and how they can improve the estimation results.
Estimation of Demand for Reserves: Minimal-Theory Approach
In our 2026 working paper, we estimate the demand for reserves using a specification that satisfies the two core theoretical restrictions discussed above:
- Reserve demand has a logistic form with boundaries disciplined by theory.
- The reserve demand relationship is allowed to shift in response to changes in administered rates.6
Figure 5 presents the resulting minimal-theory estimates.
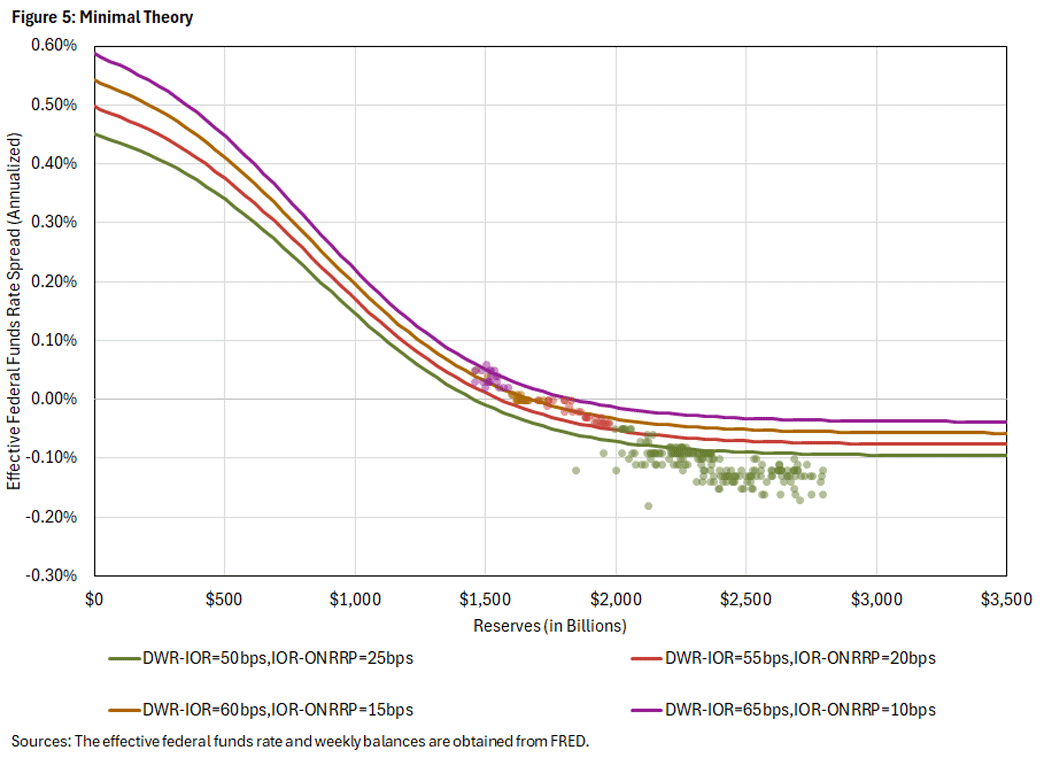
Figure 5 delivers two main messages. First, locally, the minimal-theory estimates fit the data as well as the no-theory approaches. One would therefore not reject the minimal-theory approach based on in-sample fit.
Second, the minimal-theory approach overcomes the extrapolation problem of the no-theory approach. For example, as reserves decline, the interbank rate rises smoothly toward the upper boundary. As we discuss in more detail in the paper, the minimal-theory approach also produces a global estimate of the reserve demand that is very similar to the quantitative-theoretic structural estimate in our 2023 working paper.
We think the minimal-theory estimate strikes a good balance between simplicity for everyday use practitioners and consistency with theory-based constraints. As we discuss next, the estimation procedure can matter for policy-relevant questions.
Does Approach Matter for Policy Implementation?
A natural question is whether alternative reserve demand estimates give different answers to policy-relevant questions. The answer is that they do. To illustrate, we focus on a practical measure of the success of the monetary policy implementation framework: the daily volatility of the EFFR.
Our 2023 working paper provides an estimate of reserve-draining shocks (that is, a distribution for the quantity of reserves that may leave interbank markets over the course of a day). We combine that estimated distribution with each reserve demand estimate to compute the implied volatility of the EFFR. Figure 6 plots the results.
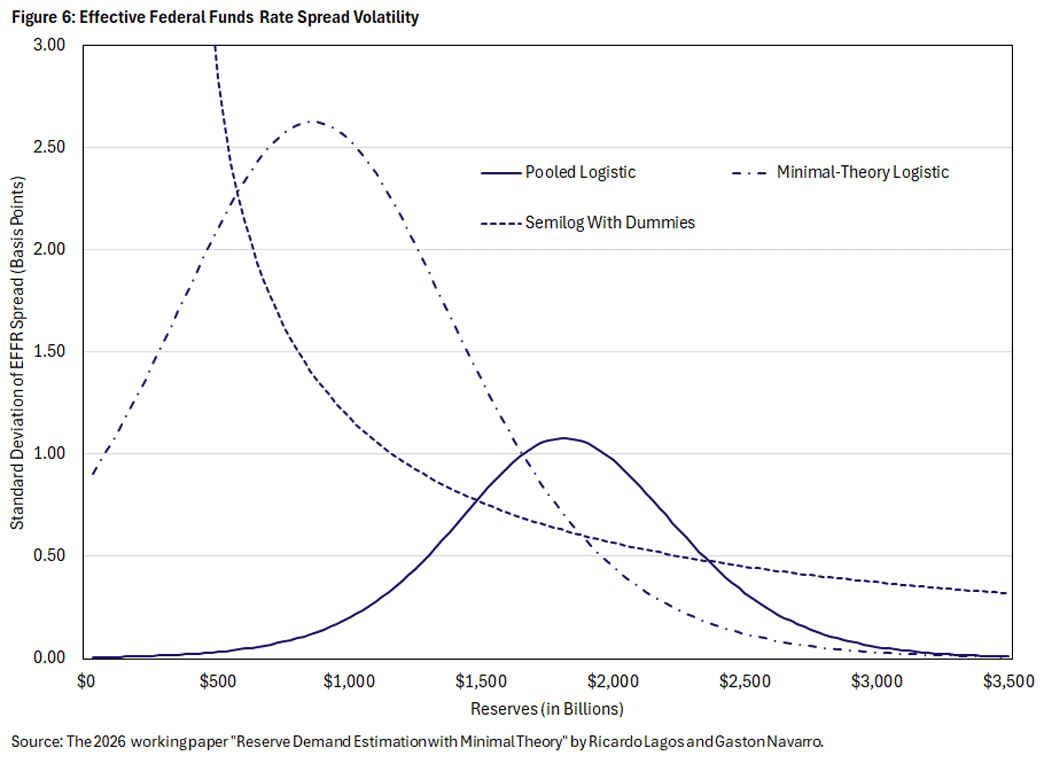
The no-theory approaches imply very different patterns of EFFR volatility. The logarithmic form implies high volatility only when reserves are close to zero, while the logistic form predicts a standard deviation of about 1 basis point when reserves are around $1.8 trillion. By contrast, the minimal-theory approach predicts a standard deviation of about 2.5 basis points but only when reserves are closer to $1 trillion. These are relevant differences for policymakers in charge of implementing the policy rate target.
Conclusions
Reserve demand estimation is central to monetary policy implementation, but doing so is not straightforward. The data alone do not clearly reveal a single reserve demand curve, and estimation results can depend strongly on the functional form imposed.
We propose a methodological middle ground that consists of combining simple empirical methods with a small number of theory-based restrictions. In our application, this minimal-theory approach fits the data well, avoids some of the extrapolation problems of no-theory methods and gives different answers to policy-relevant questions. More broadly, the results suggest that even a bit of theory can go a long way in helping improve the reserve demand estimates that guide monetary policy implementation.
Ricardo Lagos is a professor of economics at New York University. Gaston Navarro is a senior research economist in the Research Department at the Federal Reserve Bank of Richmond.
1
The seminal work in the 1968 paper "Commercial Bank Reserve Management in a Stochastic Model: Implications for Monetary Policy" by William Poole is an early contribution to deriving a demand for reserves with these properties. Similar reserve demand properties can be found more recently in the 2015 paper "Trade Dynamics in the Market for Federal Funds" by Gara Afonso and Ricardo Lagos, the 2019 paper "A Model of the Federal Funds Market: Yesterday, Today and Tomorrow" by Afonso, Roc Armenter and Benjamin Lester, and our 2023 working paper "Monetary Policy Operations: Theory, Evidence and Tools for Quantitative Analysis."
2
In practice, not all banks (or financial institutions) have access to the same IOR. Additionally, some banks may decide to borrow at a rate above the DWR, as borrowing from the Fed may carry some stigma. One could easily add adjustments to the upper and lower boundaries to incorporate these caveats.
3
See our 2026 working paper for a more detailed description of our variables.
4
Recent work following this approach includes, among others, the 1996 paper "The Daily Market for Federal Funds" and the 1997 paper "Measuring the Liquidity Effect," both by James Hamilton, the 2006 paper "The Liquidity Effect in the Federal Funds Market: Evidence from Daily Open Market Operations" by Seth Carpenter and Selva Demiralp, the 2022 working paper "Scarce, Abundant or Ample? A Time-Varying Model of the Reserve Demand Curve" by Gara Afonso, Domenico Giannone, Gabriele La Spada and John Williams, and the 2023 working paper "Reserve Demand, Interest Rate Control and Quantitative Tightening" by David López-Salido and Annette Vissing-Jorgensen.
5
Formally, we estimate a relation where is the EFFR-IOR spread. The function is either the logarithmic or a logistic function. See our 2026 working paper for more details.
6
See our 2026 working paper for more details on the minimal-theory estimation.
To cite this Economic Brief, please use the following format: Lagos, Ricardo; and Navarro, Gaston. (April 2026) "Reserve Demand Estimation: A Proposal." Federal Reserve Bank of Richmond Economic Brief, No. 26-13.
This article may be photocopied or reprinted in its entirety. Please credit the authors, source, and the Federal Reserve Bank of Richmond and include the italicized statement below.
Views expressed in this article are those of the authors and not necessarily those of the Federal Reserve Bank of Richmond or the Federal Reserve System.
Subscribe to Economic Brief
Receive a notification when Economic Brief is posted online.
Contact Us