The Postpandemic City: Urban Employment Centers and Commuting in the Fifth District
Economic Brief
June 2026, No. 26-18
Key Takeaways
- Employer-reported data through 2023 reveal a divergence in postpandemic commuting patterns across four large metropolitan areas within the Fifth District.
- Washington, D.C., lost 1 percentage point of its metropolitan area's employment share to suburban destinations between the prepandemic period (2017-19) and the postpandemic period (2023), while Baltimore, Richmond and Charlotte all maintained or increased their cores' share.
- Washington's losses fall primarily on high-earning workers and are spatially concentrated in more distant suburbs.
Transit networks, downtown real estate markets and local revenue bases across U.S. cities were designed around decades of established commuting flows to central employment districts. The COVID-19 pandemic disrupted those flows sharply, and the return to prepandemic patterns has been uneven. A key practical question remains: Are the changes in where people work — and, therefore, where they commute — a temporary disruption or a lasting reorganization of metropolitan labor markets?
This analysis uses employer-reported data through 2023 to examine that question across four metropolitan statistical areas (MSAs) in the Federal Reserve's Fifth District, with particular attention to whether the respective urban cores that anchor those flows have maintained their regional attractiveness.
Four Metros, One Shock
The four MSAs included in this analysis — Washington, D.C.; Baltimore; Richmond, Va.; and Charlotte, N.C. — were selected to include a wide range of economic structures within the Fifth District:
- Washington is the nation's largest concentration of federal civilian employment and corresponding professional and private-sector support services.
- Baltimore combines large federal agency activity with location-fixed employers, such as hospitals, universities and the Port of Baltimore (none of which can operate remotely).
- Richmond is a diversified state-capital economy anchored by health care, state government and financial services.
- Charlotte is a fast-growing southeastern metro driven by corporate relocation and in-migration, with little federal presence.
All four metro areas experienced a common macroeconomic disruption: the sharp decline of in-person work in 2020 and an uneven return to office-based employment over the following years. While MSA employment recovered by 2023 — exceeding prepandemic levels in Charlotte, Richmond and Washington, while Baltimore remained slightly below its prepandemic level — commuting structures evolved in sharply different directions.
The data source used in this analysis is the Census Bureau's LEHD Origin-Destination Employment Statistics (LODES), which tracks the home and work locations of every job covered by unemployment insurance in the U.S.1 I focus on the years 2017-23, with the prepandemic period covering the 2017-19 average and the postpandemic period represented by 2023.2
One important caveat applies to the use of these data for the present analysis. LODES has long been used to study commuting behavior on the assumption that employer location and physical commuting destination coincide. The rise of remote work after 2020 weakened that assumption. A worker may be counted as working at a physical address while rarely or never commuting there. This limitation is particularly relevant in Washington, given its high concentration of federal and professional-service employment that is well suited to remote work. The measured shifts, therefore, reflect changes in registered employer locations, not necessarily in physical commuting trips.
The analysis below is performed at the MSA level and focuses on its designated urban core.3 Workers or employers located outside the MSA boundary are not included, except where explicitly noted.
Core Employment Shares Diverged
As measured by LODES, total MSA employment changed substantially between the prepandemic and postpandemic periods: Charlotte grew 12.3 percent, Richmond grew 5.6 percent, Washington grew 2.1 percent, and Baltimore was essentially flat at -0.3 percent. In this context, an important question with direct implications for the spatial organization of economic activities is: Did each MSA's traditional urban core maintain its share of metropolitan jobs?
| MSA | Core | MSA Employment Growth | Core Employment Share | Local Integration Index | ||||
|---|---|---|---|---|---|---|---|---|
| Pre | Post | Change | Pre | Post | Change | |||
| Washington | DC | +2.1% | 22.3% | 21.3% | -1.0 pp | 15.8% | 14.2% | -1.6 pp |
| Baltimore | Baltimore City | -0.3% | 25.7% | 25.6% | -0.1 pp | 16.8% | 16.4% | -0.4 pp |
| Richmond | Richmond City | +5.6% | 24.9% | 25.0% | +0.1 pp | 17.6% | 17.6% | 0.0 pp |
| Charlotte | Charlotte City | +12.3% | 55.4% | 55.8% | +0.4 pp | 29.9% | 29.7% | -0.2 pp |
| Notes: MSA growth reflects the percentage change in total MSA employment from the prepandemic period (2017-19) to the postpandemic period (2023). Core employment share reflects the core's share of total MSA employment. The local integration index reflects the share of employed residents who live in the MSA but outside the core and who work in the core. Charlotte City is not a county-equivalent jurisdiction. It is identified using the NC LEHD geographic crosswalk applied to LODES tract-level data. | ||||||||
Among the four MSAs, Washington is the only one whose core recorded a meaningful decline in employment share. The local integration index (LII) — which measures the share of MSA residents living outside the core and commuting into it — reinforces this picture. In the prepandemic period, the LII for Washington was 15.8 percent, meaning that roughly one in six of its residents live outside the core but worked inside it. By 2023, that share fell to 14.2 percent.
Charlotte was the only MSA with a meaningful increase in core employment share, rising 0.4 percentage points (pp). Furthermore, it had an LII of 29.9 percent in the prepandemic period, indicating that close to one in three noncore residents in the Charlotte MSA commuted to the core for work. The ratio slightly declined to 29.7 percent by 2023, reflecting that Charlotte's core maintains its dominant position as the region's employment hub.
Baltimore's core employment share fell just 0.1 pp, and its LII declined 0.4 pp, a small but real decline that suggests a modest weakening of the Baltimore core's pull as a commuting destination. Richmond's core employment share and LII were essentially unchanged.
Commuting Flow Patterns Within and Beyond the MSA
While the present analysis focuses on intra-MSA commuting patterns, it is also relevant to examine how connected each metro is to its surrounding regional economy. External commuting flows, workers living outside the MSA employed inside it (inflows) and MSA residents employed outside the metro boundary (outflows) all offer a direct measure of that integration.
Table 2 documents these flows for all four metros. In the prepandemic period, between 17 percent and 24 percent of all MSA jobs were held by workers residing outside the metro, and between 10 percent and 22 percent of core jobs were held by external workers. Both inflow and outflow shares grew further across all four metros between the prepandemic and postpandemic periods, indicating that metropolitan labor markets are becoming more connected to surrounding regional economies.
| Panel A: External Inflows Share of total jobs at work location held by workers residing outside the MSA boundary. |
||||||
|---|---|---|---|---|---|---|
| Metro | MSA | Core | ||||
| Pre | Post | Change | Pre | Post | Change | |
| Washington | 17.3% | 18.5% | +1.2 pp | 10.0% | 11.1% | +1.1 pp |
| Baltimore | 22.0% | 24.1% | +2.1 pp | 15.3% | 17.9% | +2.5 pp |
| Richmond | 23.1% | 25.6% | +2.5 pp | 20.3% | 22.6% | +2.3 pp |
| Charlotte | 22.6% | 24.5% | +1.9 pp | 21.2% | 23.2% | +2.0 pp |
| Panel B: External Outflows Share of total resident workers employed outside the MSA boundary. |
||||||
| Metro | MSA | Core | ||||
| Pre | Post | Change | Pre | Post | Change | |
| Washington | 11.2% | 12.3% | +1.1 pp | 4.2% | 4.1% | 0.0 pp |
| Baltimore | 18.7% | 19.9% | +1.2 pp | 11.2% | 12.7% | +1.5 pp |
| Richmond | 18.5% | 20.3% | +1.8 pp | 15.7% | 18.0% | +2.3 pp |
| Charlotte | 17.6% | 18.8% | +1.2 pp | 14.0% | 15.2% | +1.2 pp |
| Notes: Numbers may not sum precisely due to rounding. External flows include same-state and available cross-state flows, but some cross-state flows are not captured due to data availability. Inflow shares are expressed as a percentage of total jobs at work sites, and outflow shares are expressed as a percentage of total resident workers. For this table, the Charlotte core is represented by Mecklenburg County, as Charlotte City is not a county-equivalent jurisdiction. | ||||||
On the inflow side, Richmond and Baltimore showed the fastest growth at both the MSA and core levels: Richmond MSA and core inflows rose 2.5 pp and 2.3 pp, respectively, and Baltimore MSA and core inflows rose 2.1 pp and 2.5 pp, respectively. Charlotte grew at an intermediate pace (1.9 pp MSA, 2.0 pp core), while Washington's inflow growth (to both the MSA and the core) was the smallest.
On the outflow side, Richmond recorded the largest increase at both the MSA (1.8 pp) and core (2.3 pp) levels, suggesting that its residents are increasingly finding employment across the metro boundary. Washington's core outflows were essentially unchanged.
Table 3 breaks down the intra-MSA commuting patterns across all four metros, separating employment flows involving each core into three mutually exclusive components (as a percentage of total intra-MSA flows):
- Inflows, or workers employed in the core but residing elsewhere in the MSA
- Internal flows, or workers both residing and employed in the core
- Outflows, or core residents employed elsewhere in the MSA
| Core | Inflows | Internal | Outflows | ||||||
|---|---|---|---|---|---|---|---|---|---|
| Pre | Post | Change | Pre | Post | Change | Pre | Post | Change | |
| DC | 58.1% | 55.5% | -2.6 pp | 29.5% | 32.5% | 3.0 pp | 12.4% | 12.0% | -0.4 pp |
| Baltimore City | 44.4% | 44.9% | 0.5 pp | 28.6% | 28.2% | -0.4 pp | 27.0% | 26.9% | -0.1 pp |
| Richmond City | 51.8% | 52.6% | 0.8 pp | 21.3% | 20.7% | -0.6 pp | 26.9% | 26.7% | -0.2 pp |
| Charlotte City | 38.0% | 39.0% | 1.0 pp | 49.8% | 49.2% | -0.6 pp | 12.2% | 11.8% | -0.4 pp |
| Notes: The analysis is restricted to workers whose home and workplace are both within the MSA boundary. Shares are expressed as a percentage of total intra-MSA flows involving the core. Charlotte City is identified using the North Carolina LEHD geographic crosswalk applied to LODES tract-level data and does not use Mecklenburg County as a proxy. | |||||||||
D.C. is the only core where inflows declined as a share of total flows (-2.6 pp) while the internal component grew (+3.0 pp), reflecting a shift toward workers who both live and work in D.C. In all three other metros, inflows expanded, and internal flows contracted, consistent with suburban in-commuting growing faster than the core's own resident workforce.
Internal share declines were modest, ranging from 0.4 pp in Baltimore City to 0.6 pp in Richmond City and Charlotte City. Outflow shares declined in all four metros, ranging from 0.1 pp in Baltimore City to 0.4 pp in D.C. and Charlotte City.
Charlotte City has the highest internal share. About half of all flows involving Charlotte City are workers who both live and work in the city, reflecting the city's large geographic relevance in the MSA. In the case of D.C., however, the high inflow share reflects a compact core receiving commuters from a large suburban ring. Baltimore City and Richmond City record the highest outflow shares, at roughly 27 percent each, compared with around 12 percent for both D.C. and Charlotte City.
Where the Losses Were
County-level inflow data provide a detailed view of the changes that took place in D.C. Total inflows to Washington from the rest of the metro fell 6.1 percent between the prepandemic and postpandemic periods. The losses were not spread uniformly across the suburban ring, as seen in Table 4.
| County | Pre | Post | Change | % Change |
|---|---|---|---|---|
| Prince George's, MD | 129,341 | 118,902 | -10,439 | -8.1% |
| Montgomery, MD | 91,262 | 81,138 | -10,124 | -11.1% |
| Fairfax County, VA | 74,187 | 67,462 | -6,725 | -9.1% |
| Arlington, VA | 37,460 | 32,614 | -4,846 | -12.9% |
| Alexandria City, VA | 21,194 | 19,048 | -2,146 | -10.1% |
| Prince William, VA | 14,756 | 13,350 | -1,406 | -9.5% |
| Charles, MD | 14,553 | 14,851 | +298 | +2.0% |
| Anne Arundel, MD† | 13,790 | 13,655 | -135 | -1.0% |
| Loudoun, VA | 11,560 | 12,384 | +824 | +7.1% |
| Howard, MD† | 7,872 | 7,630 | -242 | -3.1% |
| Baltimore County, MD† | 4,859 | 5,199 | +340 | +7.0% |
| Baltimore City, MD † | 4,202 | 4,837 | +635 | +15.1% |
| Total (all external) | 481,734 | 452,455 | -29,279 | -6.1% |
| Notes: The top 12 source counties are ranked by prepandemic volume. †Outside Washington MSA boundary. | ||||
The losses were concentrated in the first and second rings of suburbs: Prince George's, Montgomery, Fairfax and Arlington counties, and Alexandria City — which are the largest prepandemic sources of commuting workers for D.C. — each recorded declines of between 8 percent and 13 percent, together accounting for the bulk of the total shortfall. Some outer-ring counties — including Loudoun, Frederick and Baltimore counties — recorded modest gains.
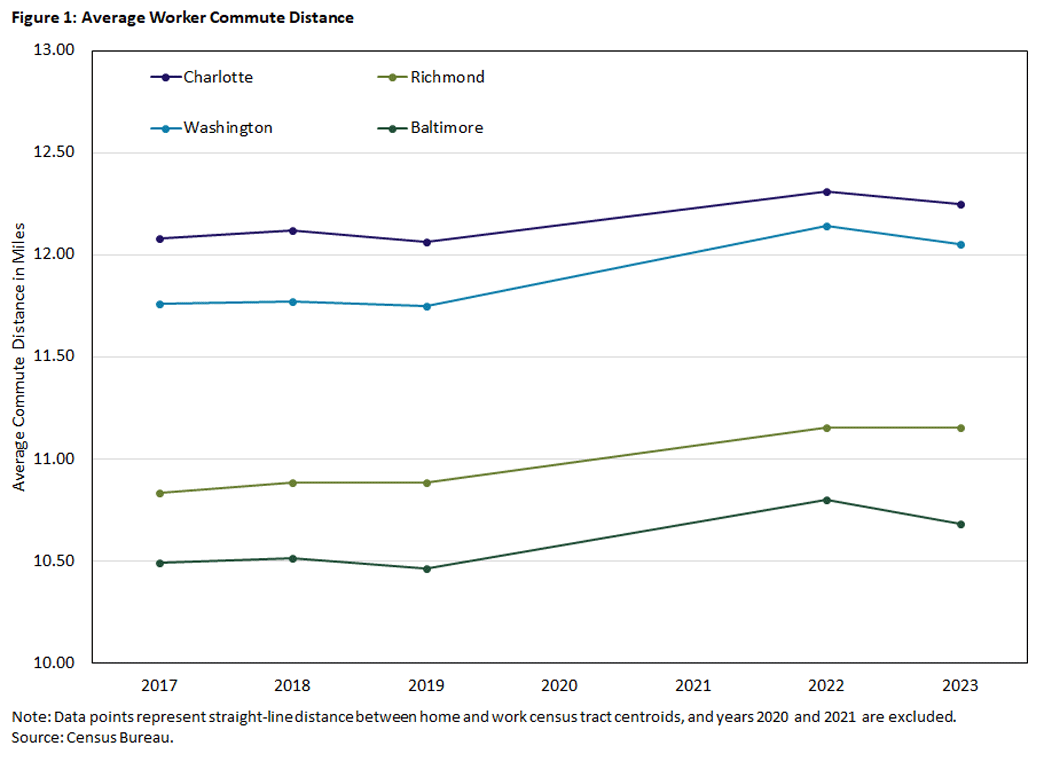
Figure 1 tracks the average commute distance in each metro from 2017 through 2023. The measure accounts for the worker-weighted average straight-line distance between home and work census tract centroids, including all commuting pairs within the MSA. Each pair is weighted by the number of workers.
Measured in this way, average commute distances increased in all four metros between the prepandemic and postpandemic periods, from 1.4 percent in Charlotte (12.1 to 12.3 miles) to 2.7 percent in Richmond (10.9 to 11.2 miles). Hence, workers are commuting to destinations farther from their homes on average even as the traditional downtown core becomes less dominant as an employment destination in Washington. This pattern is consistent with suburban employment dispersal across all four metros, though for different underlying reasons.
For each MSA, it is also possible to calculate changes in commuting flows within the MSA to the respective core at the level of individual census tracts, where each tract is a residential origin (the neighborhood where a worker lives outside the core). The question for each tract is whether the number of its residents commuting to the core rose or fell between the prepandemic and postpandemic periods. Gaining and losing tracts are then compared by their flow-weighted average distance to the core: Each tract is weighted by the size of its gain or loss, so tracts with larger changes contribute more to the distance calculation.
In Washington, the flow-weighted average distance to the D.C. core is greater for the losing tracts (10.9 miles) than for the gaining tracts (9.6 miles). The distant suburbs shed workers from the Washington commuting flow, while the inner suburbs held steady or grew.
| Core | Avg. Distance (miles) | ||
|---|---|---|---|
| Gaining Tracts | Losing Tracts | Difference | |
| DC | 9.6 | 10.9 | +1.3 |
| Baltimore City | 11.7 | 8.2 | -3.5 |
| Richmond City | 11.2 | 6.3 | -5.0 |
| Charlotte City | 13.2 | 10.9 | -2.3 |
| Notes: Tracts are classified as gaining or losing based on whether core-bound commuting flows increased or decreased between the prepandemic and postpandemic periods. Each tract is weighted by the absolute size of its flow change. Distance in miles is calculated as the straight line between home census tract centroid and the mean centroid of core tracts. Charlotte City is identified using the NC LEHD geographic crosswalk. | |||
Washington is the only metro in the analysis where the losing tracts are farther from the core than the gaining tracts. This is the pattern one would expect if long-distance commuters — who bear the highest daily time cost of office presence — were the workers most likely to adopt hybrid schedules when remote work became available.
For Baltimore, Richmond and Charlotte, the pattern runs the opposite direction: Losing tracts are closer to the core, and gaining tracts are farther away. In Richmond, the contrast is sharpest: Losing tracts average 6.3 miles from Richmond City (from the inner-suburban Henrico County area), while gaining tracts average 11.2 miles (from counties in the outer ring, including Chesterfield, Hanover and Goochland counties).
The contrast is milder in Charlotte, with losing tracts averaging 10.9 miles and gaining tracts averaging 13.2 miles from Charlotte City. The pattern across these three metros is more consistent with residential growth dynamics: Outer-ring communities expand rapidly, generating new core-bound commuters rather than shifting commuting behavior among existing residents.
Who Changed Their Commute?
Disaggregating core destination shares by earnings ranges — which is shown in Figure 2 — reveals how different types of workers contributed to the commuting changes observed in each metro. LODES reports employment in three earnings categories: CE01 (below approximately $15,000 per year), CE02 ($15,000–$40,000 per year) and CE03 (above approximately $40,000 per year). These fixed thresholds are not adjusted for inflation or local wages and define the three groups used throughout. For each earnings tier, the share is computed as all jobs located in the core in that tier (regardless of worker residence) divided by total jobs located in the MSA in that tier. A negative bar means the core captured a smaller fraction of that tier's MSA-wide jobs in 2023 than before the pandemic.
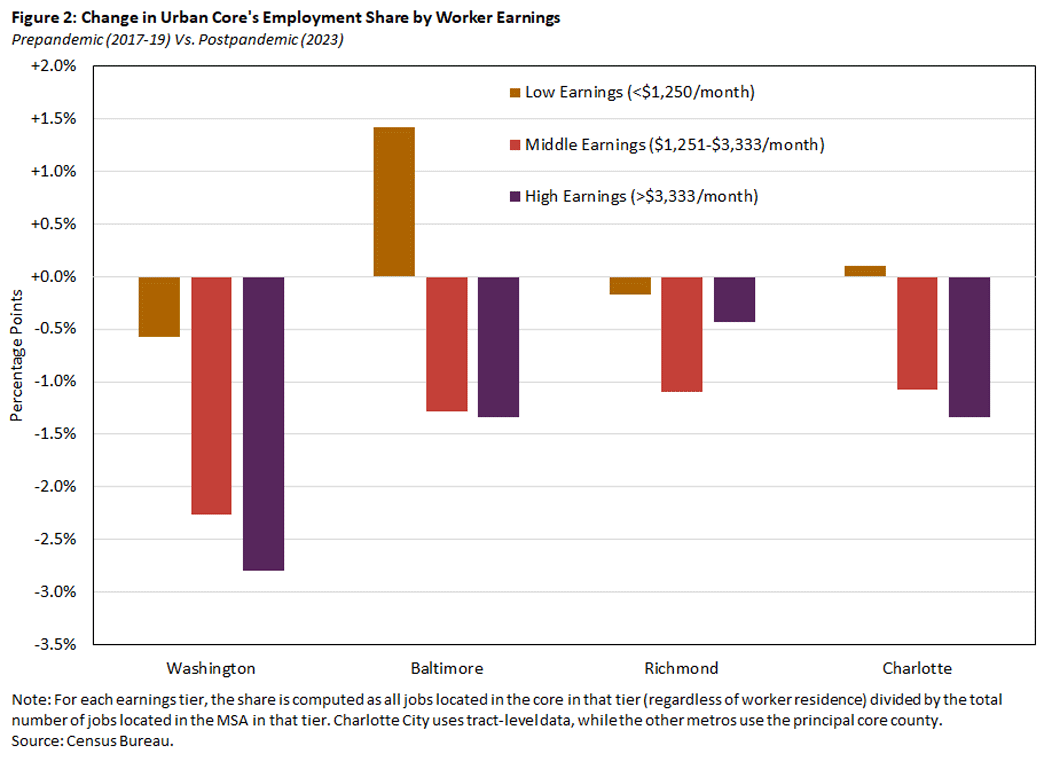
The most notable changes were observed in the D.C. core, where the shift is concentrated on the highest earners (making above approximately $40,000 per year). These are the most likely workers to hold remote work-eligible positions. While Washington's share of inbound commuting fell across all three earnings groups, the decline was largest among the highest earners, whose core destination share fell 2.8 pp (compared with a 2.3 pp fall for middle earners and 0.6 pp for low earners). High earners are perhaps the workers who were most likely to hold remote work-eligible positions in Washington.4
The case of Baltimore is somewhat different. The share of low earners working in Baltimore City rose 1.4 pp, while middle-earner and high-earner shares declined. The low-earner gain is consistent with Baltimore City's employment composition: The Johns Hopkins hospital system, the University of Maryland Medical System and the Port of Baltimore all depend on large numbers of workers in below-median-wage, in-person-required occupations.
For Richmond, the core destination share fell across all three earnings groups, but modestly and without the sharp concentration in high earners seen in Washington. The largest decline was among middle earners (-1.1 pp), and these broadly similar declines are consistent with Richmond's diversified economy, which includes health care, state government and financial services.
For Charlotte, the share of MSA low earners working there was essentially flat (+0.1 pp), while middle earners (-1.1 pp) and high earners (-1.3 pp) both declined meaningfully. Unlike Washington, where the decline is concentrated at the top of the earnings distribution, Charlotte's losses are spread evenly across the two upper tiers.
What the Evidence Implies for Policy
For Washington, the data indicate that the prepandemic model of downtown employment concentration — sustained by a large, high-wage, in-commuter base that typically relies on the regional transit network — has weakened over the postpandemic period. Reduced office presence is associated with lower levels of downtown retail spending, restaurant demand and transit ridership.5 Transit systems, downtown commercial real estate and municipal service levels designed for prepandemic volumes may require reassessment in light of these shifts.
The changes in commuting patterns documented here extend only through 2023 and thus capture only part of the structural change that has taken place in these cities. The analysis for Washington, for instance, does not account for recent changes in federal government employment. Whether these changes are temporary or represent a lasting shift in Washington's commuting landscape will become clearer as that evidence accumulates.
For Richmond and Charlotte, the analysis of commuting patterns suggests a different set of challenges. In both metros, the expansion of commuting areas to outer rings implies growing infrastructure demands in suburban counties and greater reliance on cars. The analysis also documents growth in external commuting flows across all four metros. The boundaries of these metropolitan labor markets are becoming increasingly blurred, with more workers living or working beyond the traditional metro footprint.
For Charlotte in particular, metropolitan planning frameworks that focus only on intra-MSA commuting flows may miss an increasingly significant share of the regional labor market. Strong overall employment growth in Charlotte, combined with a continued concentration around a dominant city center, suggests pressures on suburban transit access and housing affordability that are driven by growth itself rather than by remote work.
In the case of Baltimore, the evidence presents a more stable picture. Baltimore City's core employment share and commuting draw remained essentially unchanged for the postpandemic period, consistent with the dominance of its anchor institutions largely insulating the city from remote-work displacement. That said, the modest decline in the LII and the small drop in middle-earner and high-earner inflows suggest that the city's pull as a commuting destination for suburban workers in those earnings groups is not immune to structural change. For Baltimore, the policy question is less about adapting to a dramatic shift and more about sustaining the conditions that have kept anchor-institution employment concentrated in the urban core.
Santiago Pinto is a senior economist and policy advisor in the Research Department at the Federal Reserve Bank of Richmond.
1
LODES employment is derived from the same state unemployment insurance administrative records that underlie the Bureau of Labor Statistics' (BLS') Quarterly Census of Employment and Wages (QCEW). LODES figures may therefore differ from headline BLS' Current Employment Statistics, which is a separate sample-based establishment survey benchmarked to QCEW annually. Federal civilian employment is also incorporated in LODES v8 through OPM administrative records not covered by QCEW, so employment measured by LODES is more comprehensive, especially in metros with a large federal presence.
2
I use 2023 because 2020-22 is the pandemic and subsequent recovery transition period, rather than the postpandemic period, and 2023 is the most recent year for which LODES data are available.
3
The core is defined as the District of Columbia for Washington, Baltimore City for Baltimore, Richmond City for Richmond and Charlotte City for Charlotte. The first three are independent cities, but because Charlotte City is not a county-equivalent jurisdiction in LODES, it is identified using the North Carolina LEHD geographic crosswalk applied to tract-level data. For external flow calculations in Table 2 — where tract-level disaggregation is unavailable — Mecklenburg County serves as a proxy for the Charlotte core.
4
Using American Community Survey data, the 2023 paper "Worker Sprawl in the Washington Metropolitan Area: Is D.C. Still the Region's Job Hub?" by Bailey McConnell and Yesim Sayin shows that Washington's share of regional high-skill employment fell sharply after the pandemic, with neighboring jurisdictions (particularly Fairfax County) absorbing the displaced activity, consistent with the LODES-based patterns documented here.
5
See the 2021 working paper "The Donut Effect of COVID-19 on Cities" by Arjun Ramani and Nicholas Bloom and the 2023 paper "The Evolution of Work from Home" by Jose Maria Barrero, Nicholas Bloom and Steven Davis.
To cite this Economic Brief, please use the following format: Pinto, Santiago. (June 2026) "The Postpandemic City: Urban Employment Centers and Commuting in the Fifth District." Federal Reserve Bank of Richmond Economic Brief, No. 26-18.
This article may be photocopied or reprinted in its entirety. Please credit the author, source, and the Federal Reserve Bank of Richmond and include the italicized statement below.
Views expressed in this article are those of the author and not necessarily those of the Federal Reserve Bank of Richmond or the Federal Reserve System.
Subscribe to Economic Brief
Receive a notification when Economic Brief is posted online.
Contact Us