Forecasting Wage Growth Using Months Supply
Economic Brief
June 2026, No. 26-20
Key Takeaways
- I investigate how well a stock-flow measure of labor markets — months supply of effective searchers — forecasts wage growth.
- The performance is competitive or better than existing market tightness measures at a one-year horizon.
- Current wage growth is projected to be flat at around 3.5 percent.
Labor market tightness is often summarized by the vacancy-unemployment ratio, the unemployment rate or the quits rate. Each measure is useful, as they each emphasize different aspects of the labor market. In this article, I introduce a stock-flow measure of tightness that focuses on the balance between the stock of effective job searchers and the flow of hiring. I call it months supply of effective searchers. The measure assesses how many months it would take at the current pace of hiring to work through the stock of workers who are effectively available to be hired.
The exact specifications for the measure are covered in the appendix, but in summary, I weight and combine various stages of employment and unemployment and divide by total nonfarm hires. The weights translate different labor-force states into effective units of search.1 For instance, newly unemployed workers look for jobs more actively than long-term unemployed workers, so they receive higher weights.
This concept is closely related to familiar labor market tightness measures, but it is not commonly reported and to my knowledge has not been discussed.2 For example, it does not appear as a metric in Bart Hobijn and Aysegul Şahin's broad labor market dashboard.3
The closest standard analogue is the inverse of a job-finding rate. But the usual job-finding rate gauges flows from unemployment into employment. Months supply of effective searchers instead uses total hires in the denominator, which include hires out of unemployment (short-term or long-term), out of nonparticipation and from employment. For that reason, it does not map as cleanly into a single search model transition rate. One advantage of considering it — rather than a traditional measure of labor market tightness like the vacancy-unemployment ratio — is that time-varying match efficiency4 will show up here, but it doesn't show up in the vacancy-unemployment ratio.
The general idea of using labor market tightness to forecast wage growth is not new,5 but the emphasis here is different from other approaches. Many standard measures come directly from search-and-matching models. Months supply of effective searchers is more descriptive: It mixes hires from all sources and therefore should not be interpreted as the inverse of a structural job-finding rate.
Nevertheless, the economics are straightforward. If firms are hiring rapidly and the stock of effective searchers is low, the labor market is tight: Employers must compete more aggressively for workers, whether those workers are unemployed, out of the labor force or currently employed elsewhere. If hiring is weak relative to the stock of effective searchers, firms should be able to fill jobs without bidding wages up as quickly.
Months supply of effective searchers is the labor market analogue of months supply of housing. Months supply of housing asks how long it would take to sell the current inventory of homes at the current sales pace. In earlier work, I showed that the measure is a strong predictor of house price appreciation over the next year. Here, I ask whether a similar stock-flow measure for workers helps forecast wage growth, and I find it is strongly informative.
Data and Wage Measures
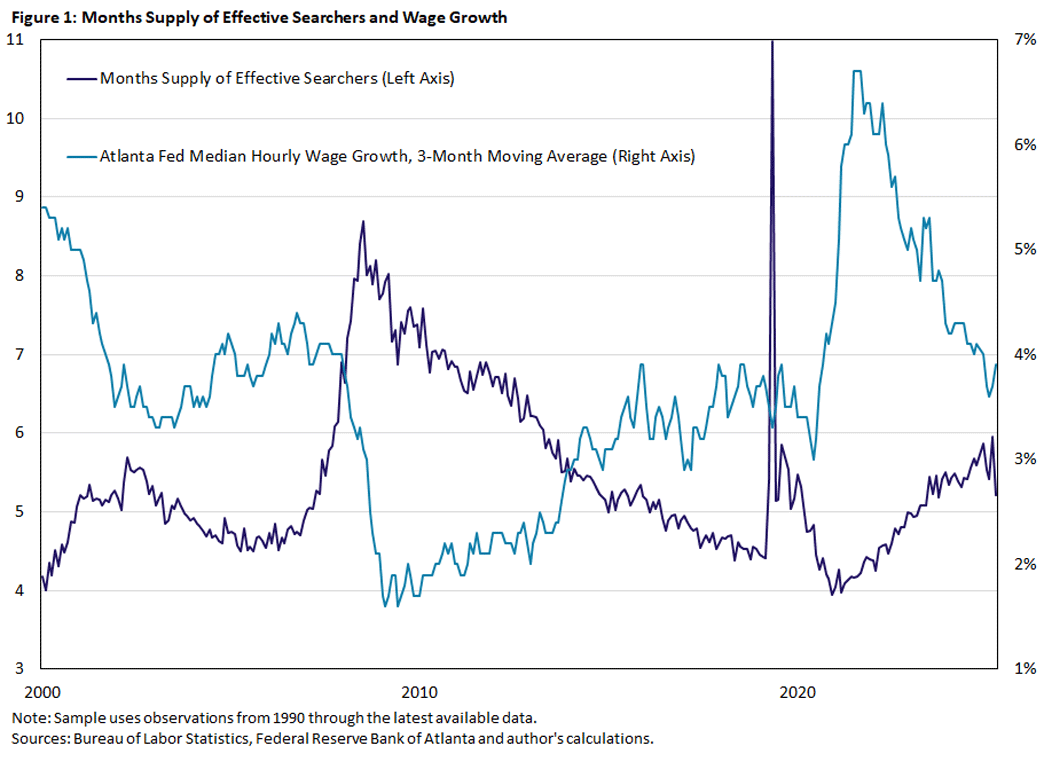
The main wage growth measure is the Atlanta Fed's three-month moving average of unweighted median hourly year-over-year wage growth. The main tightness variable is months supply of effective searchers. The hires denominator is total nonfarm hires from JOLTS, while the effective searchers variable is constructed from series described above.
Figure 1 shows the full-sample relationship between months supply of effective searchers and the Atlanta Fed wage growth measure. Visually, low months supply is associated with faster wage growth, while high months supply is associated with slower wage growth. The main exception is the COVID period, when unemployment spiked sharply and then reversed. Given the highly unusual dynamics and incentives of that period, that is an understandable disassociation.
The timing of the relationship is also informative. Figure 2 plots correlations between wage growth and lagged months supply of effective searchers, using a sample ending in 2019, prior to the pandemic. The strongest relationship with the Atlanta Fed wage measure occurs at a 10-month lag with a correlation of -0.94, but performance is nearly as accurate at a 12-month lag. If the sample is extended into 2026, the peak occurs at a nine-month lag with a correlation of -0.81, but correlation is still close to -0.8 at a 12-month lag.
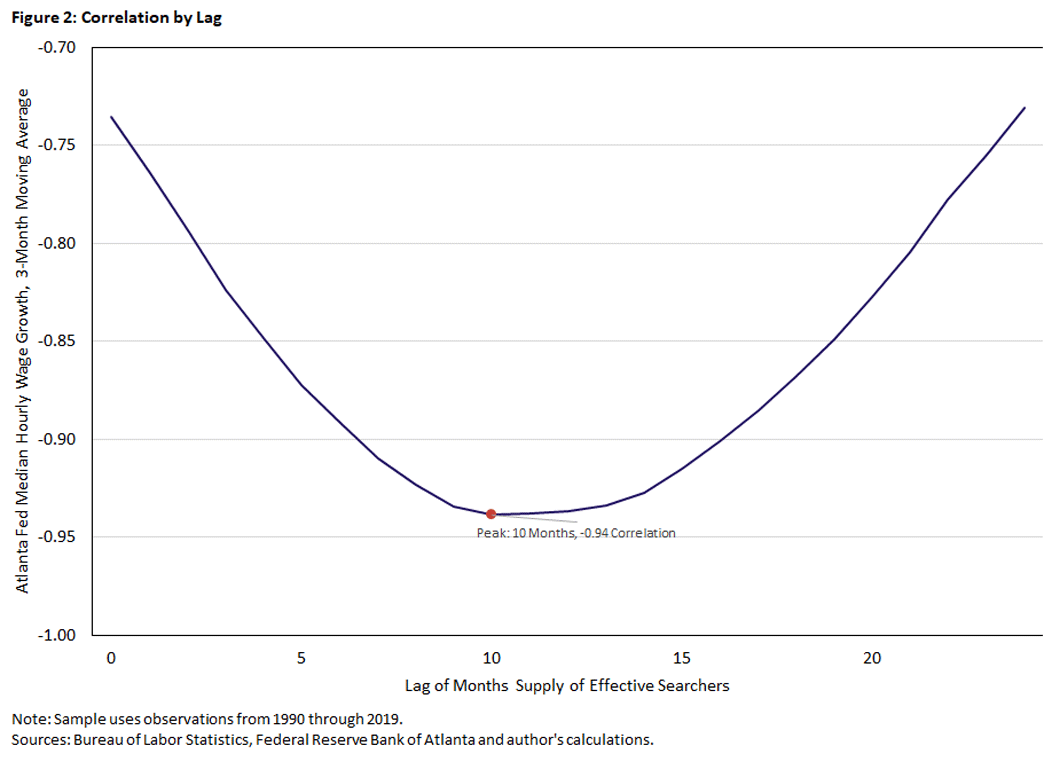
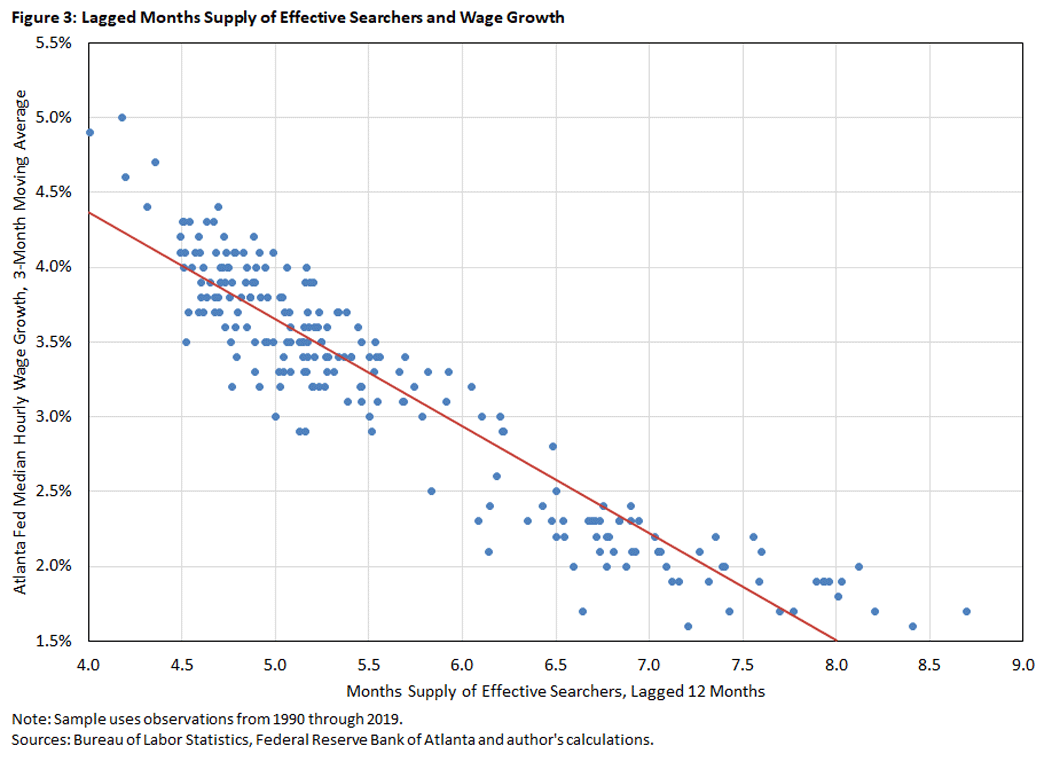
Figure 3 displays the 12-month-ahead scatterplot on the pre-2020 sample, which shows that the relationship is tight before COVID. The correlation for the full sample through 2025 is still strongly negative, but the COVID episode weakens the fit because of outliers, especially with the months supply measure hitting 11 months at the peak of the crisis.
Forecasting Performance
The simple one-year-ahead regressions show that months supply of effective searchers has substantial forecasting power. For the Atlanta Fed wage growth measure, the one-year-ahead regression using the full sample has an R2 of 0.63. In the pre-2020 sample, the R2 is 0.88.
The deterioration in the full-sample estimates is not surprising. The COVID recession generated an extreme and short-lived jump in unemployment and, therefore, in months supply. This was followed by a rapid reopening and unusually strong wage growth. In a purely statistical model, that episode looks like a forecast error. Economically, it reflects a unique disruption in labor supply, labor demand and matching.
Next, I compare months supply of effective searchers with other labor market variables in a Shapley-Owen decomposition, which asks how much each variable contributes to the explanatory power of a full forecasting model, averaged across all possible model orderings. I do this for both the pre-2020 and full samples.
| Variable | Pre-2020 Sample | Full Sample |
|---|---|---|
| Hires rate | 12.2% | 8.8% |
| Unemployment rate | 11.7% | 5.8% |
| Quits rate | 11.1% | 14.9% |
| Separation rate | 8.7% | 1.9% |
| Atlanta Fed median hourly wage growth, 3-month MA | 7.2% | 7.6% |
| Vacancies per effective searcher | 7.0% | 11.7% |
| Vacancy-to-unemployment ratio | 6.4% | 9.8% |
| Time (months since sample start) | 5.5% | 4.4% |
| Job openings rate | 5.3% | 11.2% |
| One-year expected inflation rate | 4.7% | 4.3% |
| Employer-to-employer transition probability | 3.7% | 1.7% |
| Vacancy-to-hires ratio | 3.6% | 8.3% |
| 2020 dummy | 0.414% | |
| Notes: Contributions are Shapley-Owen shares of each sample's full model R2, expressed as percentages. Pre-2020 sample full-model R2 = 0.941 using 217 observations, and full sample full-model R2 = 0.928 using 292 observations. Source: Author's calculations using FRED data. |
||
In the pre-2020 sample, months supply of effective searchers contributes 13.0 percent of the model's explanatory power, the largest contribution among all the regressors. The hires rate is close behind at 12.2 percent, followed closely by the unemployment and quits rates at 11.7 percent and 11.1 percent, respectively. These measures all have more predictive power than current wage growth, which is at a 7.2 percent contribution.
In the full sample, the contribution of months supply of effective searchers falls to 9.2 percent. While it remains one of the stronger predictors, other measures provide even more predictive power, especially the quits rate at 14.9 percent and vacancies per effective searcher at 11.7 percent.6 Interestingly, these measures do not fare as well in the pre-2020 sample, ranking fourth and seventh, respectively.
Overall, it seems months supply of effective searchers is a useful measure for forecasting wage growth, at least outside of exceptional periods like COVID.
A Dynamic Forecasting Exercise
The previous exercises are static correlations and regressions. To assess dynamic forecasting performance, I estimate a vector autoregression (VAR) that includes three variables:
- Atlanta Fed median hourly wage growth
- Months supply of effective searchers
- One-year expected inflation, measured by the Cleveland Fed's Inflation Expectations estimates
I include an inflation measure despite its relatively weak explanatory power in Table 2 to capture that, in principle, workers should care mostly about real wages.
Figure 4 shows out-of-sample rolling-forecast paths generated from many different starting dates using only information up to that point.
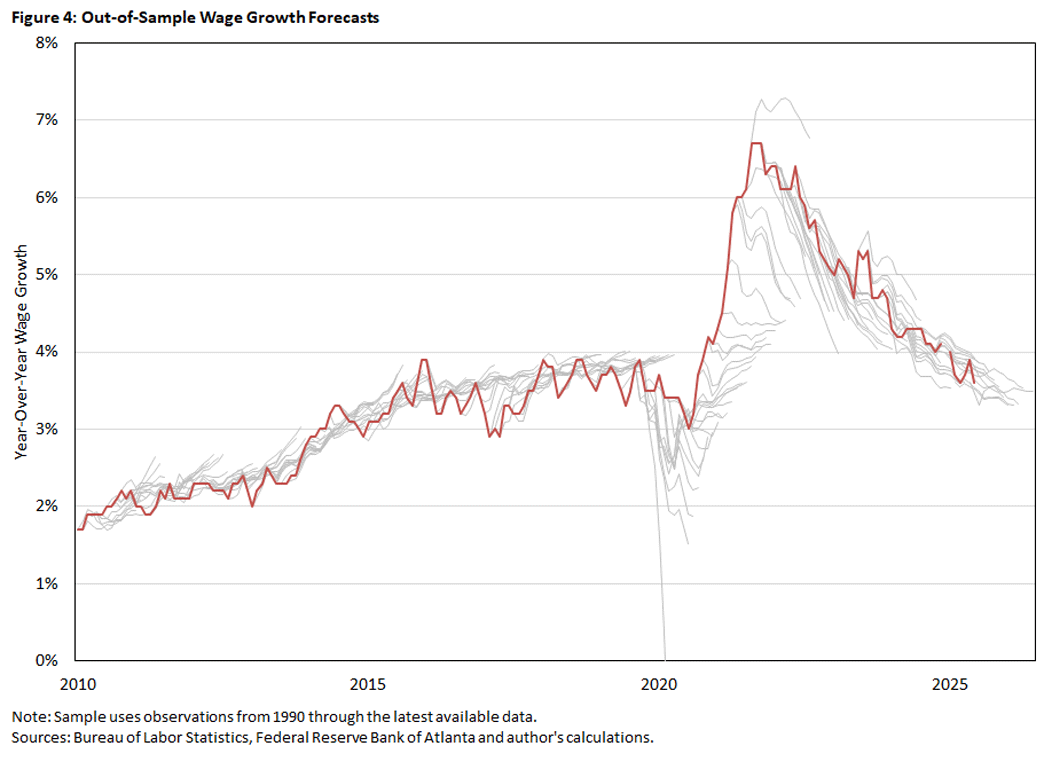
The forecasts track wage growth well in normal periods. The main miss is again the COVID period: The model reads the surge in months supply as a signal of future wage deceleration, while wage growth instead accelerated as the labor market reopened and became unusually tight. However, after the effects from COVID wane and the model incorporates more of the COVID dynamics through sample selection, the model's performance recovers and has been strong over the last few years.
Figure 5 shows the latest VAR forecast with 95 percent confidence bands.
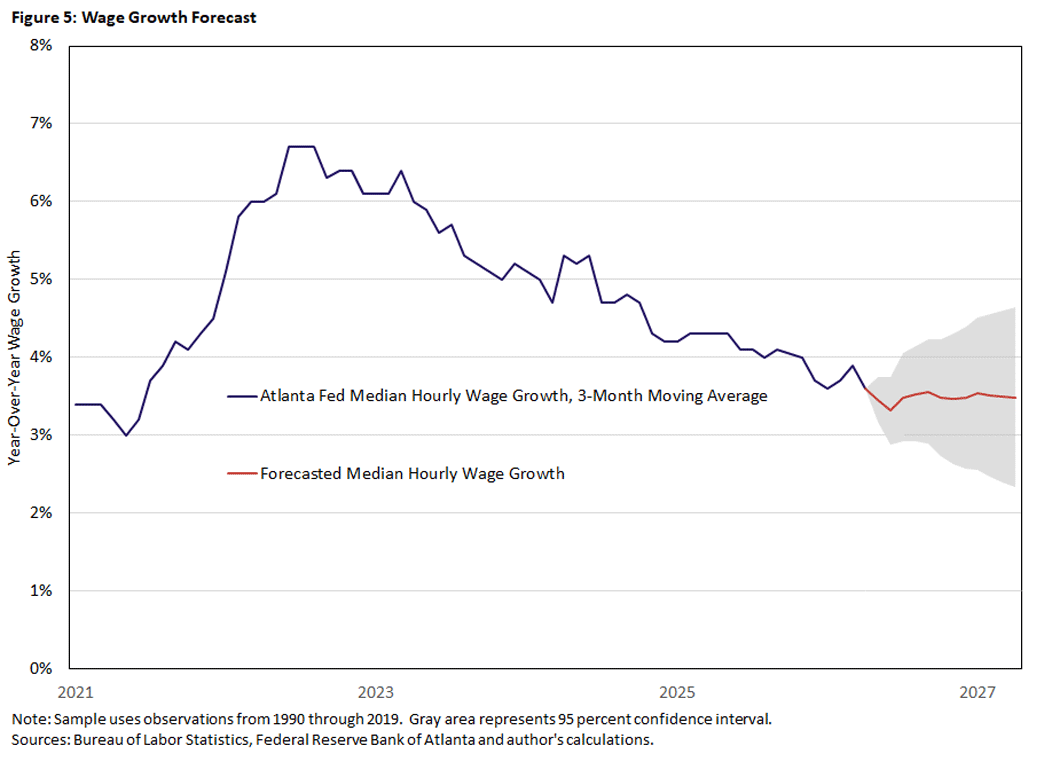
Using the latest wage observation of April 2026, the model projects Atlanta Fed median wage growth staying close to 3.5 percent over the next year. The 95 percent confidence band for April 2027 runs from about 2.3 percent to 4.6 percent. Wage growth looks to be flat at around 3.5 percent, consistent with the strong but not extreme readings from 2017 through 2019.
Conclusion
Months supply of effective searchers is a simple and intuitive measure of labor market tightness. It asks how large the effective pool of workers is relative to the current pace of hiring. That makes it a natural labor market analogue to months supply of housing.
The measure forecasts wage growth well, especially in the pre-COVID sample. A high months supply of effective searchers predicts slower future wage growth, while a low months supply predicts faster future wage growth. The relationship is strongest at horizons close to one year.
The main qualification is COVID. The pandemic produced a historically unusual unemployment spike and a rapid reversal, causing the measure to send a misleading short-run signal. But even including that episode, months supply of effective searchers remains one of the stronger predictors in a broad set of labor market indicators.
The measure should not replace canonical search-and-matching tightness variables. It is not a structural job-finding rate, and it mixes hiring from short-term and long-term unemployment, nonemployment and employment. Its value is that it captures a broad and intuitive stock-flow forecasting concept: If there is not much supply relative to demand, price pressures should accelerate. This intuition works in housing markets, and this article shows that it also carries over to labor markets.
Grey Gordon is a senior economist in the Research Department at the Federal Reserve Bank of Richmond.
1
I explored a similar measure — the months supply of unemployed, which is simply the level of unemployment divided by total nonfarm hires — but months supply of effective searchers has superior forecasting performance.
2
The 2020 paper "How Tight Is the U.S. Labor Market? (PDF)" by Katharine Abraham, John Haltiwanger and Lea Rendell discusses the closely related hires per unemployed worker, but the focus there is on the vacancy-unemployment ratio.
3
See also Hobijn and Sahin's 2025 working paper "www.LaborMarketUpdate.net: Real-Time Research-Based Analyses of the State of the U.S. Labor Market."
4
See, for example, the 2014 paper "Mismatch Unemployment" by Aysegul Sahin, Joseph Song, Giorgio Topa and Giovanni Violante.
5
The 2026 paper "Wage Growth and Labor Market Tightness" by Sebastian Heise, Jeremy Pearce and Jacob Weber provides a recent horse race and thorough review of the literature, which includes the 2015 article "Job Switching and Wage Growth" by Jason Faberman and Alejandro Justiniano; the 2017 paper "The Relative Power of Employment-to-Employment Reallocation and Unemployment Exits in Predicting Wage Growth" by Giuseppe Moscarini and Fabien Postel-Vinay; the 2017 paper "Do Job-to-Job Transitions Drive Wage Fluctuations Over the Business Cycle?" by Fatih Karahan, Ryan Michaels, Benjamin Pugsley, Aysegul Sahin and Rachel Schuh; the 2022 paper "Phillips Meets Beveridge" by Regis Barnichon and Adam Hale Shapiro; and the 2024 report "Firm Wage Setting and On-the-Job Search Limit Wage-Price Spirals" by Justin Bloesch, Seung Joo Lee and Jacob Weber to name a few.
6
These are the two measures highlighted in the previously cited 2026 paper "Wage Growth and Labor Market Tightness" as best for predicting wage growth.
To cite this Economic Brief, please use the following format: Gordon, Grey. (June 2026) "Forecasting Wage Growth Using Months Supply." Federal Reserve Bank of Richmond Economic Brief, No. 26-20.
This article may be photocopied or reprinted in its entirety. Please credit the author, source, and the Federal Reserve Bank of Richmond and include the italicized statement below.
Views expressed in this article are those of the author and not necessarily those of the Federal Reserve Bank of Richmond or the Federal Reserve System.
Subscribe to Economic Brief
Receive a notification when Economic Brief is posted online.
Contact Us