2025 Survey of Community College Outcomes

Measuring Success: Results from the 2025 Survey of Community College Outcomes
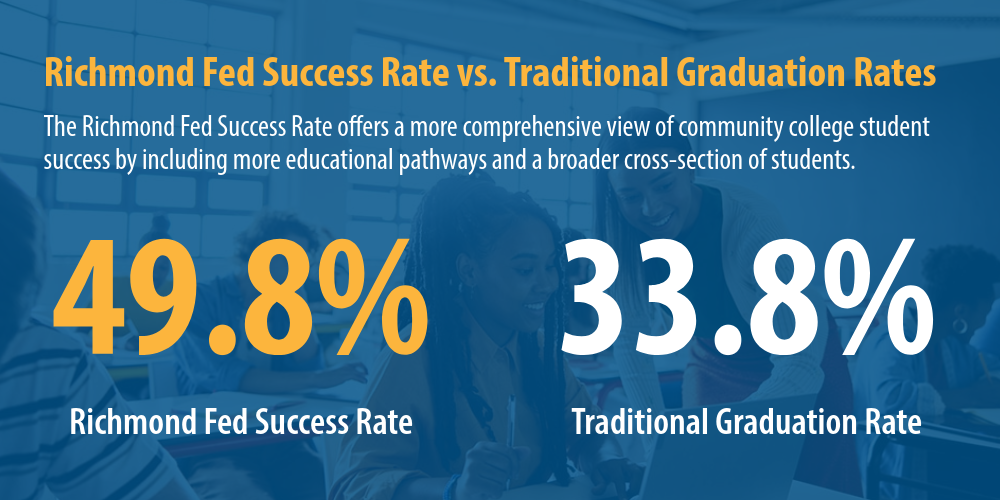
In 2025, the Survey of Community College Outcomes (SCCO) collected data on 189 community and technical colleges, including 121 schools in the Fifth District. The aggregate Richmond Fed success rate for the 2020–21 cohort of students was higher than a more traditional graduation rate, in part because it included students who spanned the range of pathways and programs offered by community colleges.
Last Updated March 30, 2026
Introduction
Community colleges play a critical role in our workforce development system by providing education and programming that enable students and workers to reach their full economic potential. The Survey of Community College Outcomes (SCCO) was initiated as a means to capture the programs and performances of community colleges using a novel methodology that can be replicated across schools and states. In 2021, the SCCO began as a pilot study of 10 schools, and by 2024, it expanded to cover 121 community colleges across the Fifth Federal Reserve District, which includes the District of Columbia, Maryland, North Carolina, South Carolina, Virginia, and most of West Virginia. The 2025 SCCO grew further by adding schools from Arkansas, Iowa, Massachusetts, New Jersey, and Texas, bringing the total to 189 community colleges.
The 2025 SCCO captures enrollment and awards for the 2023-2024 study year. To provide a robust picture of community colleges’ contribution to education and workforce preparation, these data cover students who are seeking credit-bearing degrees as well as those taking classes as non-degree students. We capture data on high school student enrollment and credits and, where available, data on non-credit workforce students. The survey captures student success for a cohort of students who entered the institution during the 2020-2021 cohort entry year.
Traditionally, policymakers, researchers, and the public have relied on graduation rates from the U.S. Department of Education’s Integrated Postsecondary Education Data System (IPEDS) to evaluate success for any post-secondary institution, including community colleges. Although there is no perfect measure of success, the traditional graduation rate often excludes the students who community colleges serve and the programs they provide.
Our signature metric — the Richmond Fed Success Rate — is a community college-specific measure of institution-level student success. It accounts for the full spectrum of students attending community colleges as well as the range of pathways that students are pursuing at community colleges. This release offers a first look at success rate results from the institutions in the survey.
Our Community College Insights page will feature insights from the 2025 SCCO throughout the year and provide detail on the Richmond Fed Success Rate and the value of taking a broader approach to community college success. We hope that this data will provide useful insights into the role community colleges play in their unique service areas. We also hope that this data from a range of states with consistent definitions will allow for richer research on the ways that community colleges serve both students and employers.
The 2025 SCCO Data Collection
The institutional structure that surrounds community and technical colleges differs notably by state. In most states, individual institution data for this survey was provided through a single entity: a state-organized community college system or the state higher education agency. In some states, however, data on students and programs were collected and reported entirely by the individual college. The evolution of this work highlighted the diversity of structure, programs, and focus of community colleges throughout the nation. Collecting data on states outside of the Fifth District enables a broader understanding of both challenges and opportunities in our workforce development system. The states and schools in this survey represent colleges or systems of colleges that actively sought to better understand their own cohorts and programs.
Table 1: 2025 SCCO School Coverage
| State | # of Community Colleges | SCCO Data Provider(s) |
|---|---|---|
| Maryland* | 14 | Individual institutions |
| North Carolina | 58 | State community college system |
| South Carolina | 16 | State community college system |
| Virginia | 23 | State community college system |
| West Virginia | 9 | State organization |
| Arkansas | 22 | State higher education agency |
| Iowa | 15 | State higher education agency |
| Massachusetts | 15 | Individual institutions |
| New Jersey* | 15 | Individual institutions |
| Texas** |
2 | Individual institutions |
We worked closely with data providers to ensure consistent definitions, standardized reporting timelines, and data collection processes across states. We employed a robust data validation and review process, taking all feasible steps to ensure data accuracy. Because we collect institution-level data, we rely on data providers to aggregate student data for SCCO reporting.
Redefining Success Using the Richmond Fed Success Rate
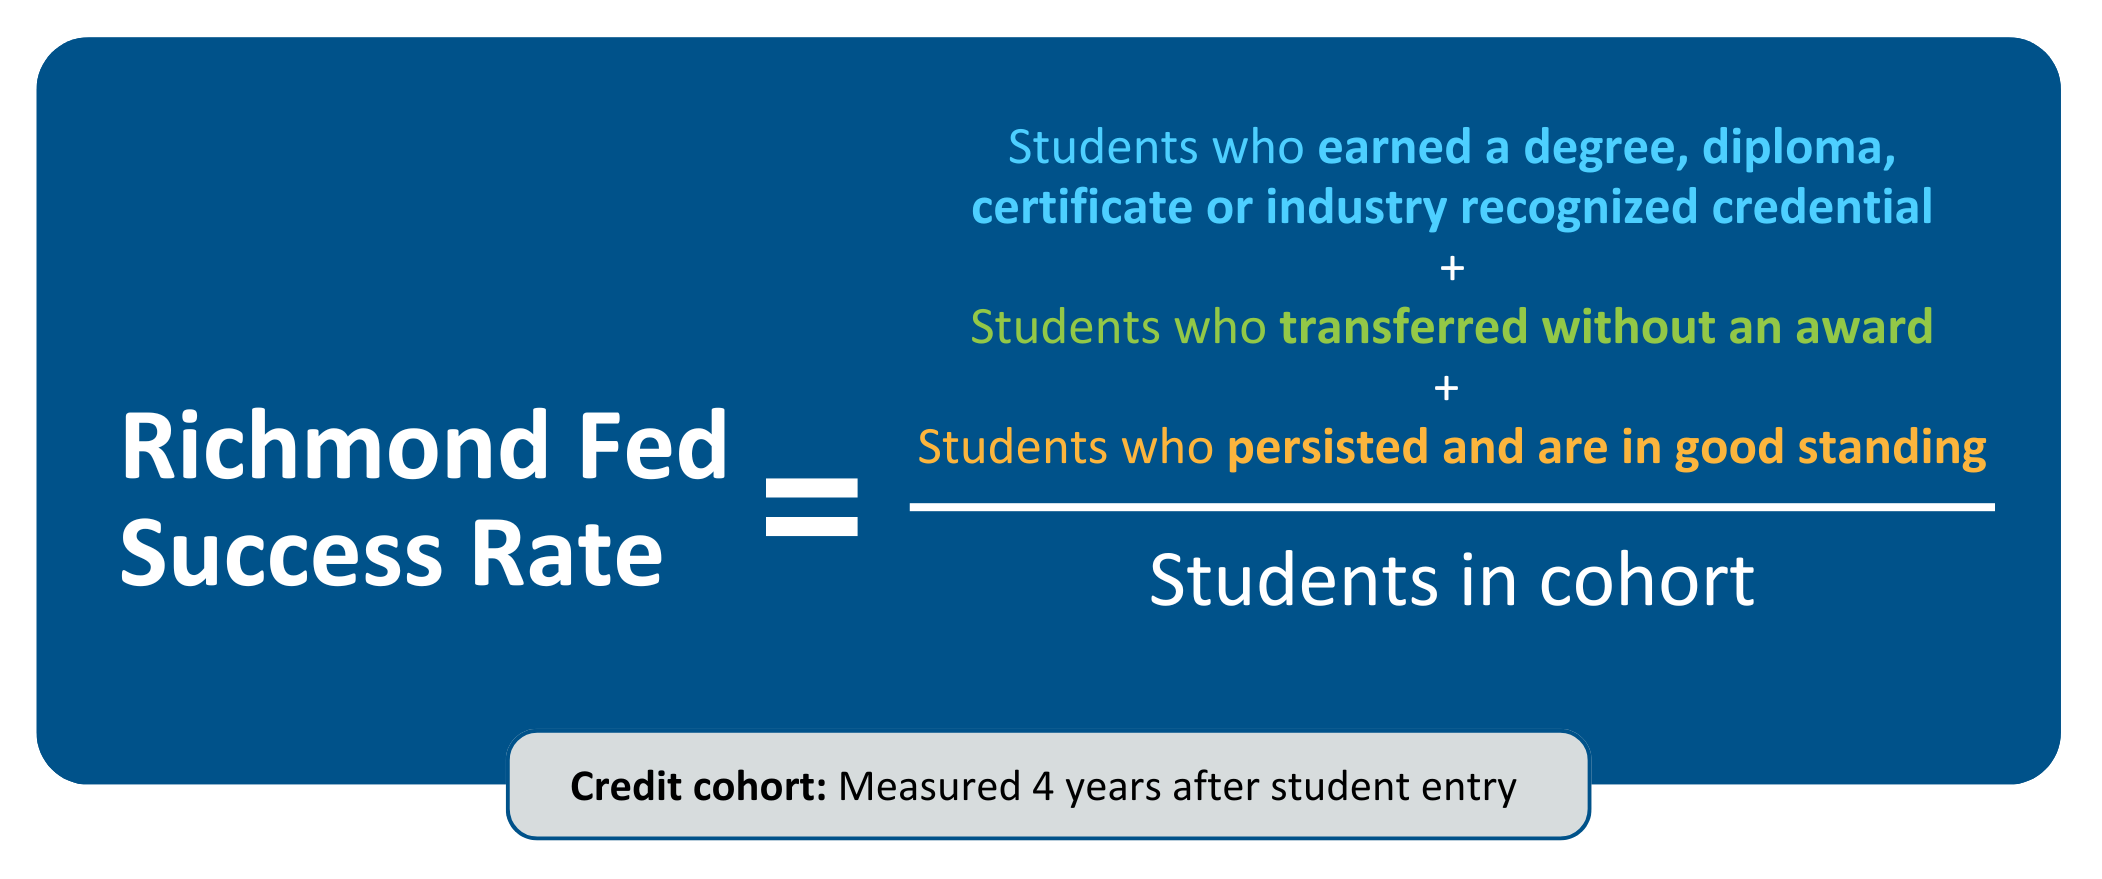
To construct a success rate parallel to a traditional graduation rate, we used a denominator (cohort of students) and a definition of success (outcomes students in the cohort achieve) that reflects community college students and their pathways. We use a four-year time horizon to measure success.
Table 2: Comparing Cohorts
| Traditional Graduation Rate Cohort | Richmond Fed Cohort | |
|---|---|---|
| Enrollment Type | Award-seeking credit students | Award-seeking credit students |
| Enrollment History | First-time students at any post-secondary institution | First-time students at this institution |
| Semester of Entry | Fall semester | Anytime during cohort entry year |
| Credit-Hour Enrollment Status | Full-time students | Full-time and part-time students |
| Success Timeline | 150% expected time to completion | 4 years after entry |
By including more of the student population served by community colleges, the cohort size for the Richmond Fed Success Rate is consistently larger than the representative graduation rate cohort. For schools that primarily serve traditional students who meet IPEDS cohort criteria, the increase in cohort size is relatively small. Schools that serve a significant number of part-time students or students who have prior college experience can have a cohort that is many times larger than the traditional graduation rate cohort.
To construct a numerator that reflects the key pathways community college students pursue, we include students who meet the traditional graduation measure (e.g., students who were awarded a degree/qualifying long-term certificate). Cohort students who do not meet this criterion are still counted as “success” if they meet one of the following criteria:
- Awarded a workforce-recognized credential or licensure (e.g., non-credit certificate or credential issued by the institution, state-issued licensure, industry certification exam);
- Transferred to a four-year institution prior to earning an award from the community college; or
- Persisted (enrolled in any term during the study year, completed at least 30 credit hours, and had a 2.0 GPA).
The revised definition of student success with the expanded community college cohort yields the Richmond Fed Success Rate:
Our success rate, while more inclusive of community college students than traditional graduation rates, should be considered a lower-bound estimate of the true rate of student success. We do not capture students who enroll in non-credit workforce-oriented programs in the success rate. The workforce credentials we capture in some states undercount the true number of students enrolled in these programs. These are often issued by third-party providers and are not reported to institutions or higher education agencies.
Pathways to Student Success: Results From the SCCO
The aggregate Richmond Fed’s success rate across the 189 institutions in the survey was 49.8 percent for the cohort of students who entered in the 2020-21 study year. A sample traditional graduation rate measure for the same group of schools — based on the IPEDS 2023-2024 150 percent graduation rates — is 33.8 percent. The success rate among full-time students, which is a closer parallel to a traditional graduation rate that excludes part-time students, is 56.6 percent.
State Success Rates: Policy, Demographics, and Structure
As we discussed in our 2024 survey results, differences in state policy, funding, and higher education systems are reflected in aggregate state success rates. The composition of the cohort in each state also plays a role. We encourage you to delve into the survey results using the dashboard below. Select your state of interest from the dropdown to explore deeper insights by gender and credit-hour enrollment status in the state aggregate data as well as how the Richmond Fed Success Rate compares to a traditional graduation rate.
Even within states, both the magnitude and composition of institution success rates vary significantly.
In future publications, we will further explore the state policies that affect community colleges, pathways, and student success. We will also discover how institutional and student characteristics drive the pathways that students pursue. In the remainder of this release, we highlight the importance of a flexible measure of community college success with a cursory look at how community college success varies across the 189 colleges we surveyed.
Even Within States, Geography Matters
Community colleges are, by definition, designed to serve the students in their local communities. Depending on the community resources available, colleges must address non-skill barriers that may hinder educational attainment. In addition, factors such as the concentration of higher education institutions near a community college and the composition of local employers and the skills required for the local labor market influence the types of programs and credentials provided by a community college.
Aggregated, student success rates across four broad IPEDS urban-rural classifications or (“locales”) (rural, town, suburban, and city) are relatively similar, ranging from 48.8 percent to 52.8 percent (see chart below). Traditional graduation rates range from 30.8 percent for the city cohort to 42 percent for the town cohort.
Geographic setting is just one factor affecting student success. While we see trends that align with the urban-rural landscape, success rates vary across institutions within each of these categories.
Success Pathways Vary Along Student Characteristics
Community colleges serve a broad group of students, including students who are seeking credentials for a certain career, students who plan to pursue a degree at a four-year institution, adult students who are already in the workforce, and many more.
In this section, we examine how success rates vary along two sets of dimensions: enrollment status and age. We will explore these characteristics and others in more detail in future publications.
Credit-Hour Enrollment Status (Part-Time Versus Full-Time)
Compared to four-year institutions, community colleges tend to enroll larger shares of part-time students. These students are excluded from traditional graduate rates, although they are sometimes included in broader measures of student success (for instance, the IPEDS Outcomes Measures).
We classify students as either full-time or part-time based on their credit-hour enrollment status during their first full semester in the 2020-2021 cohort entry year. Students may enroll in a degree or certificate program on a part-time basis (defined as fewer than 12 credit hours per semester) for a range of reasons that can make their path to educational success look different from full-time students. At community colleges, students often fluctuate between full- and part-time enrollment, so status in the first semester is not necessarily representative of a student’s overall status during the cohort measurement period.
Overall, the part-time student success rate is 43.6 percent — roughly 13 percentage points below the full-time student success rate.
Comparing the composition of success rates across full- and part-time students yields some surprises. For example, the primary difference in success rates comes from the much larger share (a 17-percentage point difference) of full-time students earning associate degrees.
Because part-time students tend to succeed at lower rates than full-time students, institutions with predominantly part-time cohorts tend to have lower overall success rates relative to institutions with cohorts comprised largely of full-time students.
Age
We break down each school’s cohort into three age groups based on the age of students in the first semester, limiting it to students who have already graduated from high school1. Across the 115 institutions for which we have age data, 12 percent (23,068 students) were under the age of 18 when they entered the institution. Two-thirds of students (127,312) were between the ages of 18 and 24. Adult learners (ages 25 and older) comprised 22 percent of the cohort.
On aggregate, the youngest group of students have the highest rate of success at 61.2 percent. Students ages 25 and older have the lowest success rate. Younger students tend to have higher rates of successful outcomes, with the greatest gap being in urban areas where students under 18 have an aggregate success rate 20 percentage points higher than those ages 25 and older.
These results are not entirely surprising: Adult learners are more likely to be employed full-time or have caregiving responsibilities compared to recent high school graduates. Therefore, these students may face more roadblocks to completing their education, while younger students may benefit from a financial safety net by a parent or guardian.
Students in the youngest cohort outperform older students in both attaining associate degrees and transferring to four-year institutions. On the other hand, compared with younger students, older students are more likely to complete certificates/post-secondary diplomas and workforce credentials. This aligns with trends we see broadly: Adult learners tend to gravitate toward shorter-term credentials instead of two- and four-year degrees.
Considerations and Conclusions
Community colleges play a fundamentally different role in higher education and workforce pathways than four-year institutions, serving students at different stages along a broad range of workforce pathways. The ways we assess and understand these institutions matters. The Richmond Fed Success Rate does not capture every student that succeeds and thus should be treated as a lower-bound estimate of success for these community colleges. There are areas where data coverage are sparse, which does not allow us to fully examine certain populations of students. Nonetheless, the Richmond Fed methodology and Richmond Fed Success Rate take us closer to accurately evaluate the unique role of community colleges in our workforce development system.
About the 2025 Survey of Community College Outcomes
The files below provide information about the sources referenced in the charts and the methodology for the construction of the Richmond Fed Success Rate.
1
Analysis involving the student age dimension does not include North Carolina or South Carolina due to reporting inconsistencies.
Contact Us