Are We There Yet? The Road Back to 2 Percent Inflation
Economic Brief
March 2026, No. 26-09
Key Takeaways
- Trend inflation has remained between 2.5 percent and 3.0 percent since the third quarter of 2023.
- Housing and food are key sectors for this trend.
- While services inflation has steadily fallen from its peak, goods inflation has risen since the latter half of 2024.
Despite falling substantially from its peak of 7.5 percent in 2022, inflation has not yet reached the Federal Reserve's 2 percent target. This situation raises several questions. Is inflation approaching the target, or has progress stalled? Which sectors are most important for the persistent part of inflation? Are prices being temporarily elevated by tariffs, and, if so, are these effects diminishing? In this article, I discuss these questions using an inflation model I previously discussed in 2023.
First, though, it's important to note that the answers are not straightforward. The data are noisy, as there are measurement issues (such as government statistics relying on representative but incomplete data samples) and one-off disturbances (such as short-lived spikes in energy prices). Moreover, aggregate inflation depends on numerous sectors in the economy, each with different statistical properties that vary over time.
Also, policymakers can only influence inflation with a lag. Rather than allowing high-frequency fluctuations in inflation or arbitrary sectors to dictate policy, they need to extract the persistent component of aggregate inflation from the data. This is a key measure of the current state of inflation for policy.
How Can We Estimate Trend Inflation?
To remove the noise from the data and aggregate the signals from each sector, I use the statistical model discussed in the 2016 paper "Core and Trend Inflation" by James Stock and Mark Watson. The model uses quarterly personal consumption expenditure (PCE) inflation data from 17 sectors and decomposes each sector's inflation into two components: a trend component that captures persistent variation and a transitory component that captures nonpersistent variation. The trend components are then averaged (weighted by the expenditure shares of each sector) to obtain an aggregate trend, which serves as a measure of the overall state of inflation.
In this formulation, the aggregate trend is a weighted average of inflation in each of the sectors, where the weights differ across sectors for two reasons:
- Volatile sectors receive a lower weight because less of their variation is explained by their trend.
- Sectors receive a larger weight if they account for a larger share of total consumption expenditures.
Thus, the importance of each sector's inflation data for the aggregate trend depends on both its expenditure share and its fluctuations.
What Is Trend Inflation Today?
Figure 1 shows the path of headline inflation and trend inflation from the 1960s through the end of 2025. While trend inflation has fallen substantially since its most recent peak of 5.9 percent in the third quarter of 2022, it has stalled at between 2.5 percent and 3.0 percent since the third quarter of 2023. The 90 percent error bands (indicated by the shaded regions) are also relatively tight, suggesting that the data are informative about this conclusion.
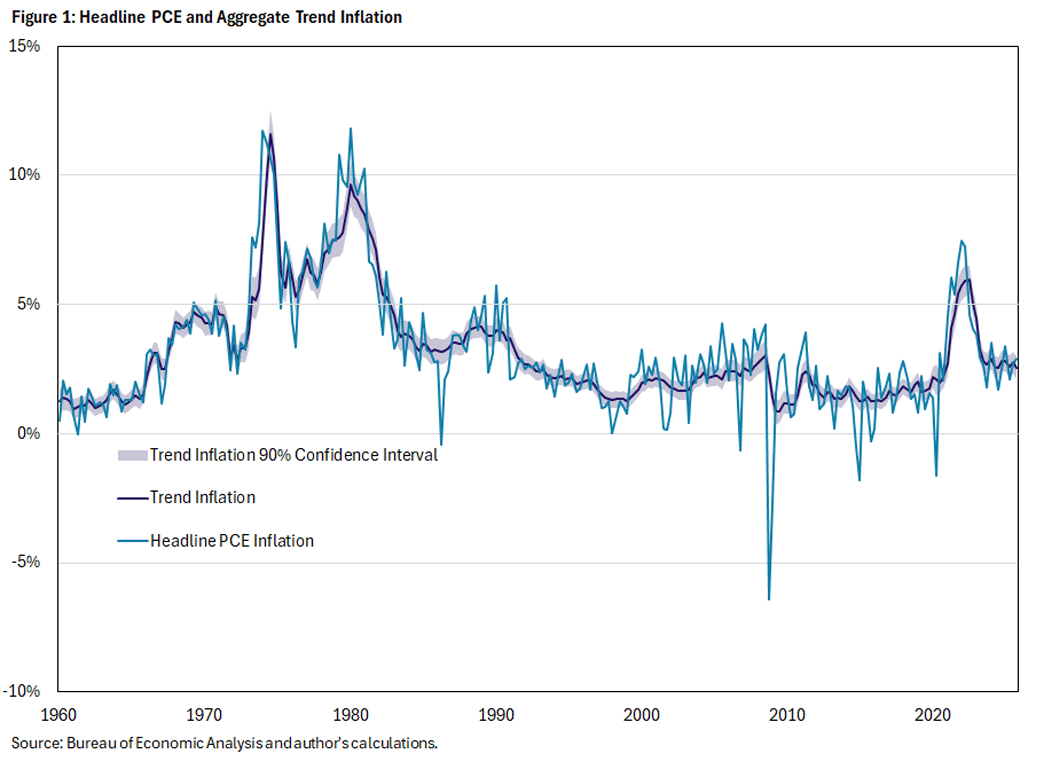
My measure of trend inflation is consistent with other measures that attempt to remove noise from the inflation data:
- The Federal Reserve Bank of New York's Multivariate Core Trend Inflation — which is a monthly version of the model presented here — is at 2.9 percent.
- The Federal Reserve Bank of Dallas' Trimmed Mean Inflation for January was at 2.7 percent.
- The Federal Reserve Bank of Cleveland's Median PCE Inflation (year-over-year) is at 2.9 percent.
- Core PCE inflation in the fourth quarter of 2025 was 2.7 percent annualized.
Each of these present the same conclusion: Inflation has fallen but remains above the Fed's 2 percent target.
Which Sectors Matter Most?
The model allows for calculating the contribution of each sector to changes in trend inflation. Greater weight is placed on a sector if its inflation varies smoothly over time and if it constitutes a large share of total expenditure. Since both of these properties can change over time, the importance of different sectors can also vary across periods.
Figure 2 compares the contribution of each sector to trend inflation versus its expenditure shares. As expected, the highly volatile energy sector receives close to zero weight, since we typically expect changes in energy prices to mostly decay within the quarter. The small weight on the energy sector is in line with the definition of core inflation, which places exactly zero weight on the sector.
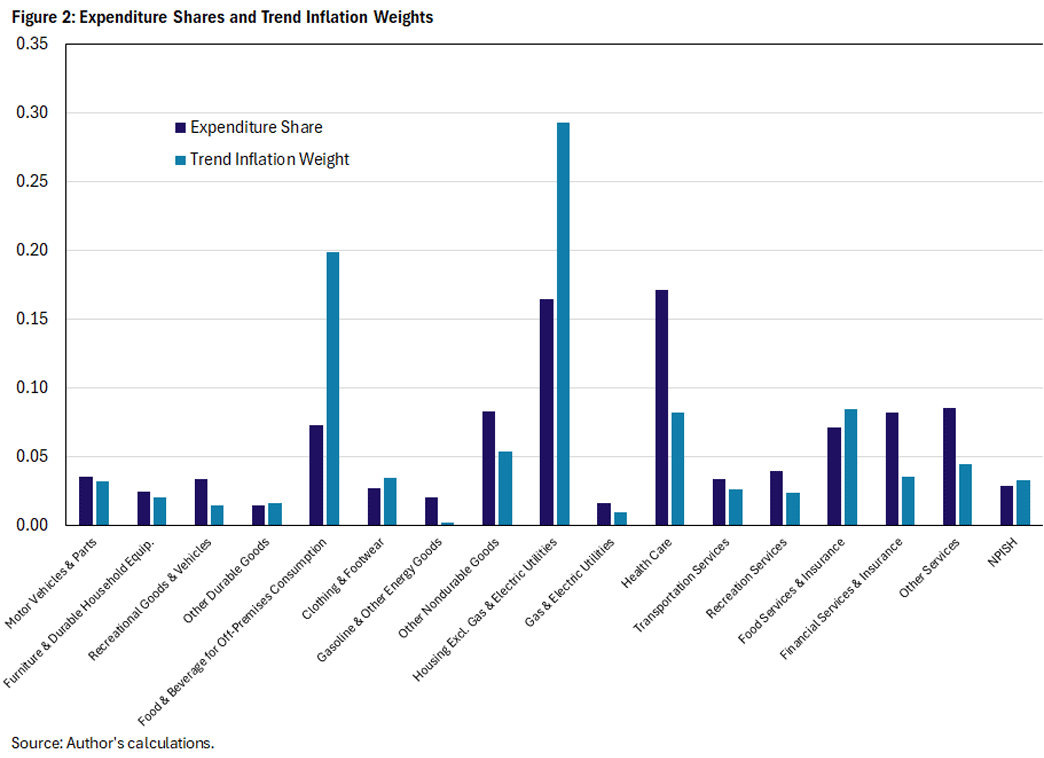
However, the weights in other sectors differ substantially from popular measures of the persistent part of inflation. For instance, the most important sectors are housing and food, which comprise about half the weight despite the former being excluded from so-called "supercore" inflation and the latter being excluded from core inflation. The model thus suggests some limits to focusing only on either supercore or core inflation.
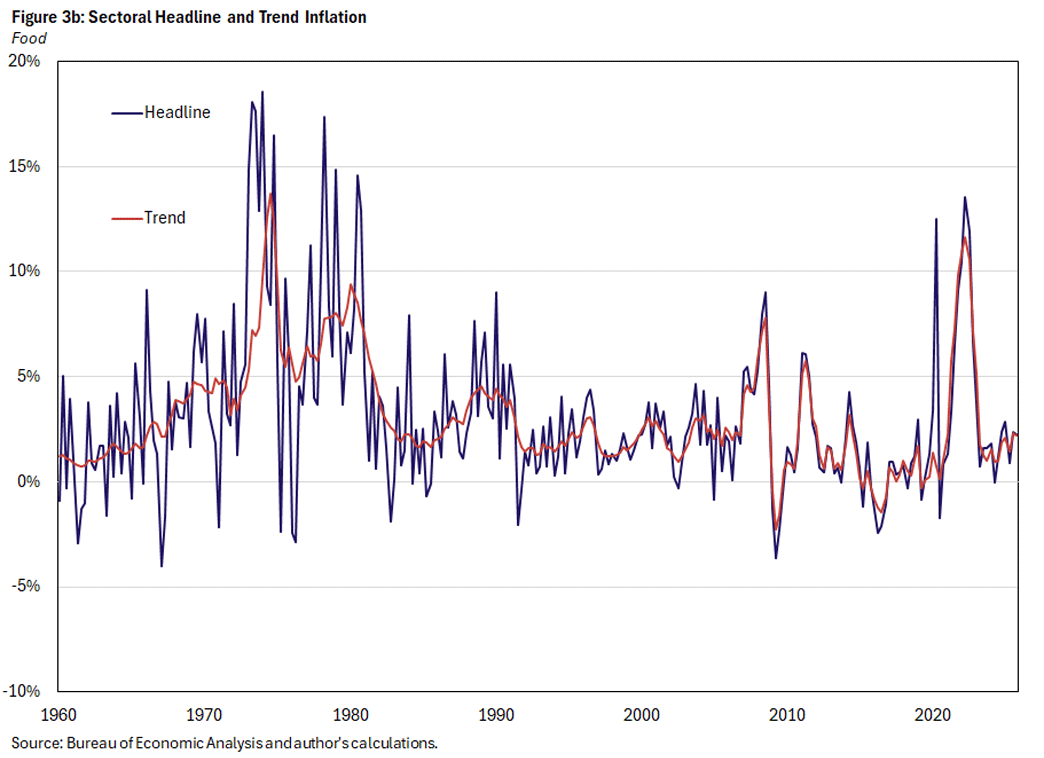
In fact, both the housing and food sectors receive about two to three times as much weight as their expenditure shares alone would imply. The high weights reflect the relative smoothness of inflation in each of these sectors in recent years, which we see in Figure 3. When a sector experiences less high-frequency volatility, that sector’s inflation today is more informative about its behavior in the future. Consequently, it provides a greater signal about the direction of aggregate inflation.
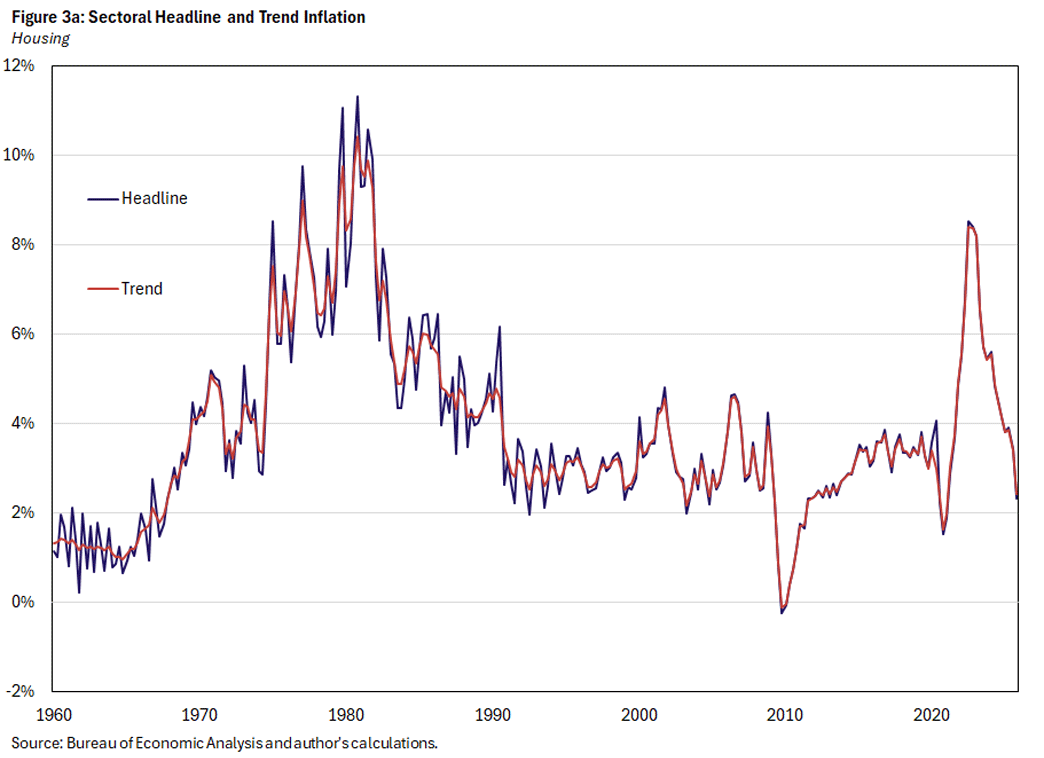
Housing and food inflation were not as smooth prior to 1990. In particular, the volatility in food prices in the 1970s made it natural to ignore food (together with energy) and construct core inflation as a measure of inflation that is more indicative of future prices. The results emphasize the need to continually reassess the properties of the data and not take as given that inflation is going to continue behaving as it did decades ago.
Which Sectors Are Propping Up Aggregate Trend Inflation?
There is a striking difference in how housing and food trend inflation have evolved over the past two years. The disinflation in housing has remained steady, with trend inflation in the sector falling to 2.4 percent in the fourth quarter of 2025, which is below its prepandemic average. As I noted in my previous article, some argued that this decline could lead inflation back to the Fed's 2 percent target, since other sectors appeared to be close to prepandemic levels.
Instead, the lower housing inflation has been offset by other sectors. For example, Figure 3 shows that, after falling by over 10 percent from its 2022 peak, food trend inflation has inched up from its trough of 1.0 percent in 2023 to 2.2 percent at the end of 2025.
These patterns reflect a broader contrast between how trend inflation in goods and in services has behaved over the past one to two years. This dichotomy can also provide suggestive evidence of the effect of tariffs, since we expect these effects to impact goods more directly. However, the measure has limited precision because sectors within each category have varying degrees of exposure to tariffs and effects are redistributed across the economy through production linkages. That is, a firm's costs could rise if it purchases inputs from another firm directly impacted by the tariffs.
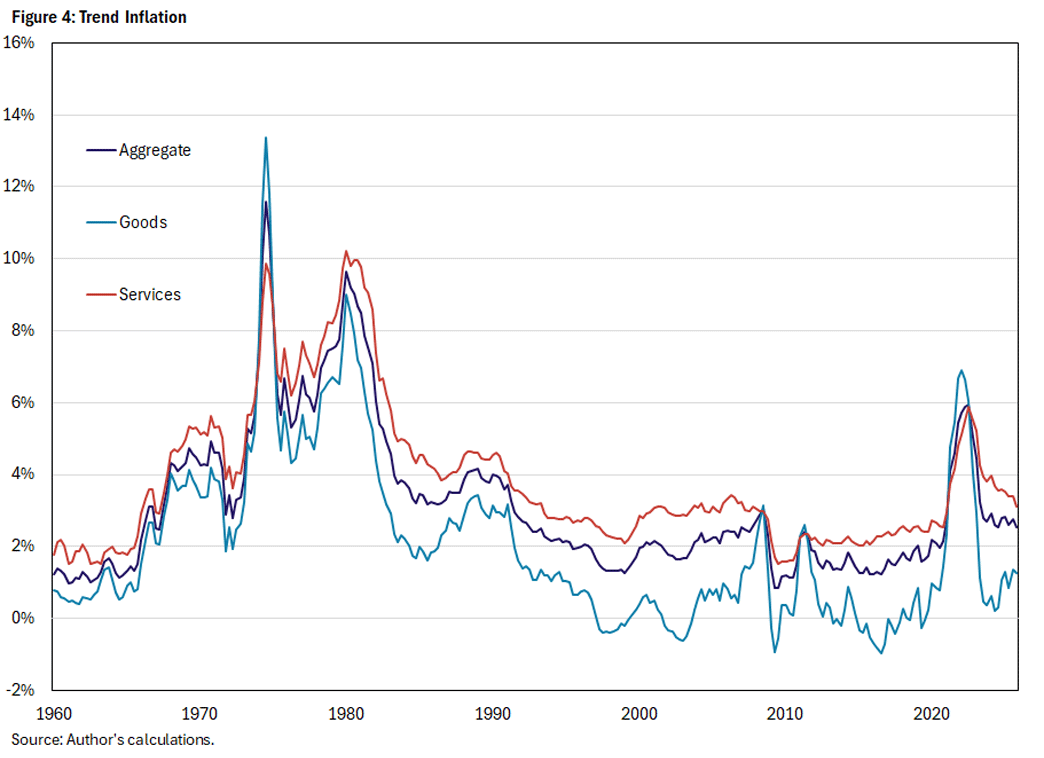
Figure 4 aggregates the 17 sectors into goods and services and compares the trends in each category to the aggregate. While the trend for services has continued falling steadily from its peak of 5.9 percent in 2022, goods trend inflation has been increasing. The rise began in the second half of 2024, before the 2025 tariffs were first implemented. However, in attempting to produce a smooth trend, the model may attribute a spike in trend inflation as having started slightly before the actual increase. In short, the behavior of housing and food inflation is also reflected more broadly in their respective categories, but I cannot conclusively isolate the role of tariffs.
Conclusion
More than four years after the postpandemic run-up, inflation remains stubbornly above 2 percent. The results here further emphasize that we should expect inflation to stay at this elevated level in the near term. Indeed, the most recent PCE release reported that year-over-year inflation was 3.1 percent in January. Since the model is purely statistical and not designed to assign causality, I cannot disentangle the actual sources of this persistence in inflation without further analysis. Nevertheless, it is noteworthy that the increase in goods inflation since the end of 2024 has propped up inflation, cancelling out the effect of disinflation in housing and the service sector more broadly.
Paul Ho is a senior economist in the Research Department at the Federal Reserve Bank of Richmond.
This article may be photocopied or reprinted in its entirety. Please credit the author, source, and the Federal Reserve Bank of Richmond and include the italicized statement below.
Views expressed in this article are those of the author and not necessarily those of the Federal Reserve Bank of Richmond or the Federal Reserve System.
Subscribe to Economic Brief
Receive a notification when Economic Brief is posted online.
Contact Us