How Much Does the US Economy Rely on Fossil Fuels?
Economic Brief
July 2026, No. 26-21
Key Takeaways
- Regarding aggregate gross output, the share of fossil fuel inputs is similar in 2024 to what it was in 1947.
- The use of fossil fuels as an input in the production of gross output differs across sectors, as do the forces driving this use.
- The aggregate use of fossil fuels is driven by two groups: the fossil fuel industry — which uses a large and stable share of fossil fuels — and service sectors that are growing in size, despite their decreasing intensity of fossil fuels usage.
How much does the U.S. economy rely on fossil fuels? Most discussions on this issue focus on the share of foreign oil use in the U.S. economy, with policy prescriptions being framed in terms of foreign energy reliance. However, the Energy Information Administration notes that the U.S. is now a net exporter of petroleum, which means the U.S. is currently not reliant on foreign fuels on net. That said, the key determinant of fossil fuel use lies in the sectoral energy requirements of U.S. production. If the production of goods and services suddenly required very little fossil fuels, the question of where to source fossil fuels from becomes less central.
In each industry,1 the evolution of fossil fuel requirements is governed by two main forces:
- Changes in the inputs needed to produce a given level of output
- Structural changes in the demand for goods from different sectors
The former will reflect, in part, changes in the intensity of fossil fuels use relative to all other inputs. The latter will reflect, in part, changes in the composition of final demand toward goods that may require more or less fossil fuels to produce.
In this article, we use transformations of input-output data to analyze how the extent of fossil fuels in different sectors has influenced the aggregate use of fossil fuels in U.S. production over time. We then explore counterfactual scenarios that highlight the role of changes in the composition of input requirements in production relative to that of structural change in accounting for fossil fuel use.
Setting the Stage for Examining Fossil Fuel Use
We begin with definitions of various input and output measures provided by the Bureau of Economic Analysis (BEA). A sector's gross output is defined as the sum of that sector's value added and intermediate inputs used. Value added in a sector is its contribution to aggregate GDP. Intermediate inputs are the goods and services used in the production process of other goods and services, and this group includes energy, raw materials, semi-finished goods and services.
In this analysis, we employ the Make and Use of Commodities by Industries, Before Redefinitions tables. Both tables are published by the BEA in its Input-Output Accounts Data and describe the nominal flow of commodities to/from industries. The use table describes the use of commodities as intermediate inputs measured in producer's prices, by private industries and in final demand,2 as well as the total use of each commodity and the value added and gross output of each industry. The make table, on the other hand, describes which industries produce which commodities.
The organization of these two tables is not conducive to an industry-by-industry analysis, as the make table is industry-by-commodity and the use table is commodity-by-industry. Moreover, the make and use tables present nominal quantities, but the intensity of a given input use in production is given by its expenditure share relative to other input expenditure shares. In this case, we're examining how much is spent on fossil fuels relative to all other inputs in production. Therefore, an industry-by-industry analysis requires a preliminary transformation of the data that combine the make and use tables.3
For this analysis, we choose to aggregate the make-use tables into 16 sectors, shown in Table 1.
| Agriculture and associated activities | Mining and Utilities | Fossil Fuels | Construction |
| Durable Goods | Nondurable Goods | Wholesale Trade | Retail Trade |
| Transportation and Warehousing | Information | Arts and Entertainment | Finance, Insurance and Real Estate (FIRE) |
| Professional and Business Services (PBS) | Education, Health Care and Social Assistance | Other Services Excluding Government | Government |
Here, the fossil fuels sector is composed of sectors covering oil and gas extraction and petroleum and coal products. That sector is fixed as the source, meaning we are only considering the flow of intermediate inputs from the fossil fuel industry.
Aggregate Use of Fossil Fuels
We first calculate each industry's use of fossil fuels as a share of aggregate gross output. It can be broken down into two components:
- The intensity of fossil fuel use in that industry's production of gross output
- The industry's relative size in the economy
In a given industry, the intensity of fossil fuel use in the production of its own gross output is the product of two pieces of data: the elements of the transformed make-use table and that industry's share of intermediate inputs of their gross output. The elements of the transformed make-use table indicate how much is spent on fossil fuels as a share of total intermediate inputs expenditures. Intermediate inputs shares give the relative importance of intermediate inputs in gross output production. It then follows that the product of these two data points shows how intensely fossil fuels are used in gross output production in different industries.
An industry's relative sectoral size is given by the share of that industry's gross output to aggregate gross output. Conventionally, one uses value-added shares as a measure of relative sectoral size, but value-added shares do not account for intermediate inputs, which are integral to our analysis. Moreover, there are no major differences over time in the evolution of value-added shares in GDP and that of gross output shares in aggregate gross output. Therefore, for our purposes, using one or the other is somewhat immaterial.
Multiplying these two objects and summing across industries yields the aggregate share of fossil fuels used in aggregate output. This aggregate share is shown in Figure 1.
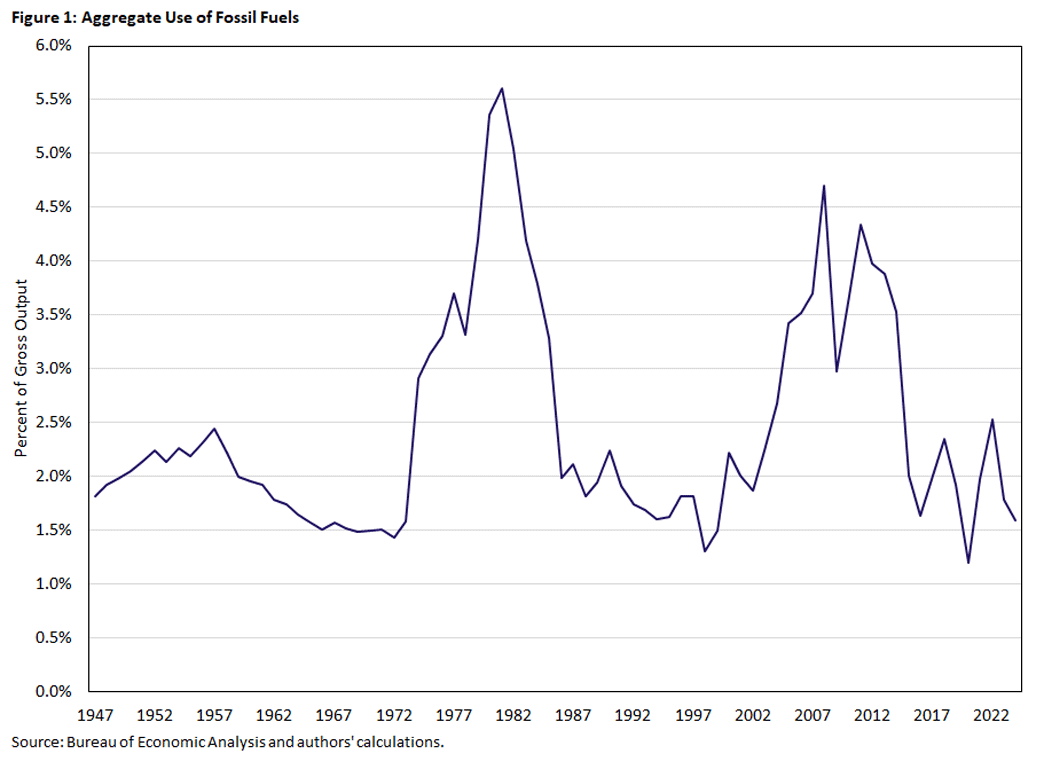
What stands out in this graph is that — despite periods of spikes centered around the oil crisis of the 1970s and the Second Gulf War in the early 2000s — the share of fossil fuels used in production has more or less not changed in the past several decades. In fact, the share of intermediate inputs from fossil fuels used in gross output was 1.8 percent in 1947 and 1.6 percent in 2024.
Sector Use of Fossil Fuels
While the spikes related to oil shocks are common across sectors, the amount of fossil fuel inputs used in 2024 relative to 1947 differs across sectors. To explore this sectoral heterogeneity, we break down each sector's share of fossil fuel intermediate inputs use in aggregate gross output into two effects: a structural change effect and a composition effect.
For each sector, we calculate the composition effect by holding its gross output share fixed at its 1947 observation and multiplying it by the fossil fuel intensity observed in the data. This indicates what the share of fossil fuel use would have looked like if there were no structural change (that is, if the sector became no more or less important to the aggregate economy). We compute the structural change effect the same way, only holding the intensity of fossil fuel use constant in each sector to its 1947 value to show what a sector's fossil fuel use would've looked like with no changes to input use.
This decomposition allows us to observe not only which sectors are driving the aggregate fossil fuel use share but also why. We classify them into three groups:
- The first group are those sectors where the structural change and composition effects offset each other.
- The second group contains sectors where one effect dominates the other.
- The third is those where both effects work in tandem.
Offsetting Effects
The first group is represented by sectors covering information; professional and business services (PBS); education, health care and social assistance (EHS); and other services excluding government sectors.4 Figure 2a shows the intensity of fossil fuel use, Figure 2b shows the relative sectoral size, and Figure 2c shows their product.

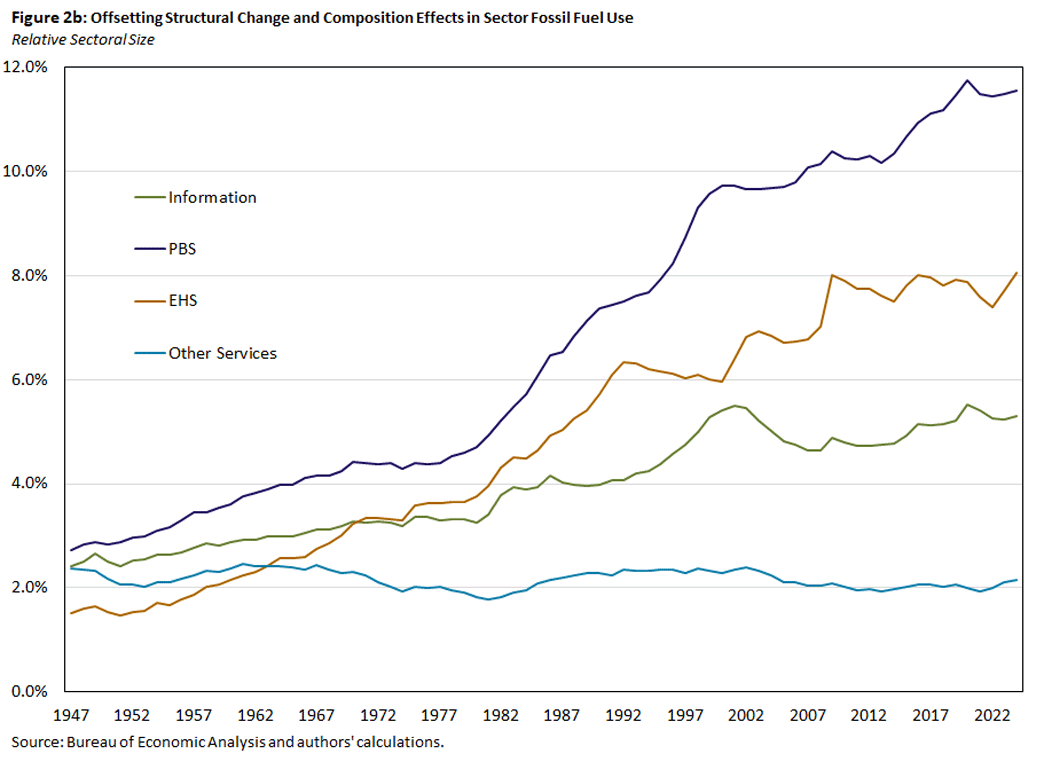
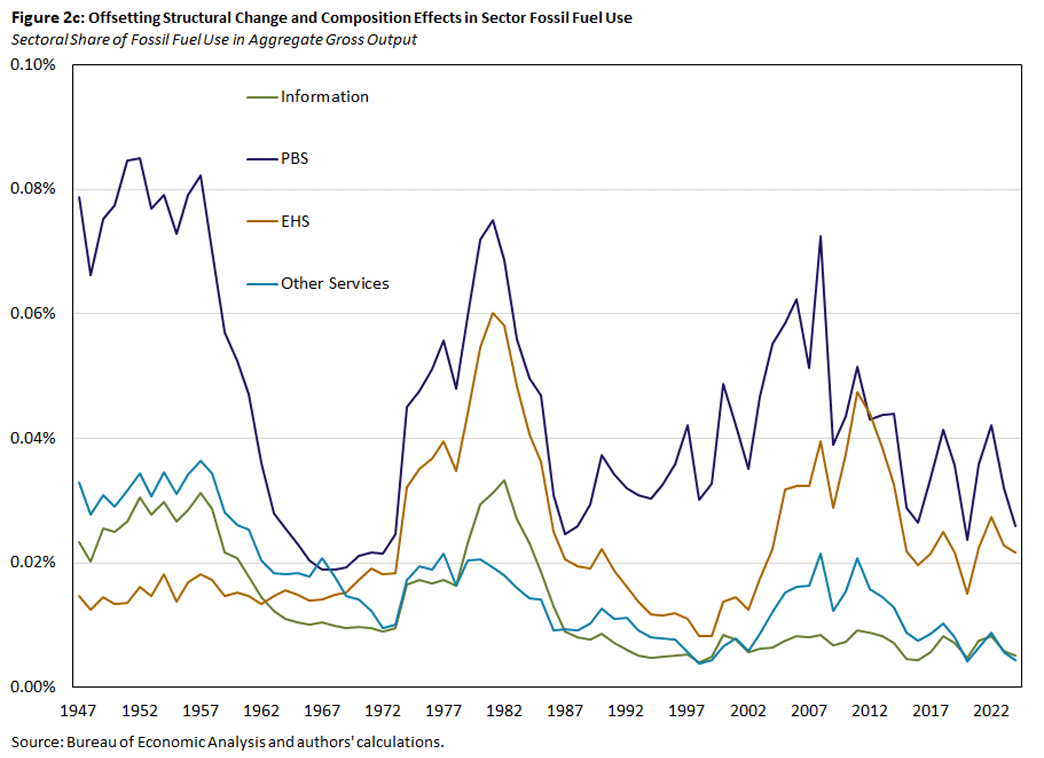
All four of these sectors show a decline in their fossil fuel use intensity, and all except other services show a rising gross output share. This leads to mixed results for each sector as all except EHS demonstrate a falling share in fossil fuel inputs in aggregate gross output.
Figure 2d shows the decomposition of effect, and it is clear across the four sectors that the effect attributable to structural change is offset by the within-industry composition effect.
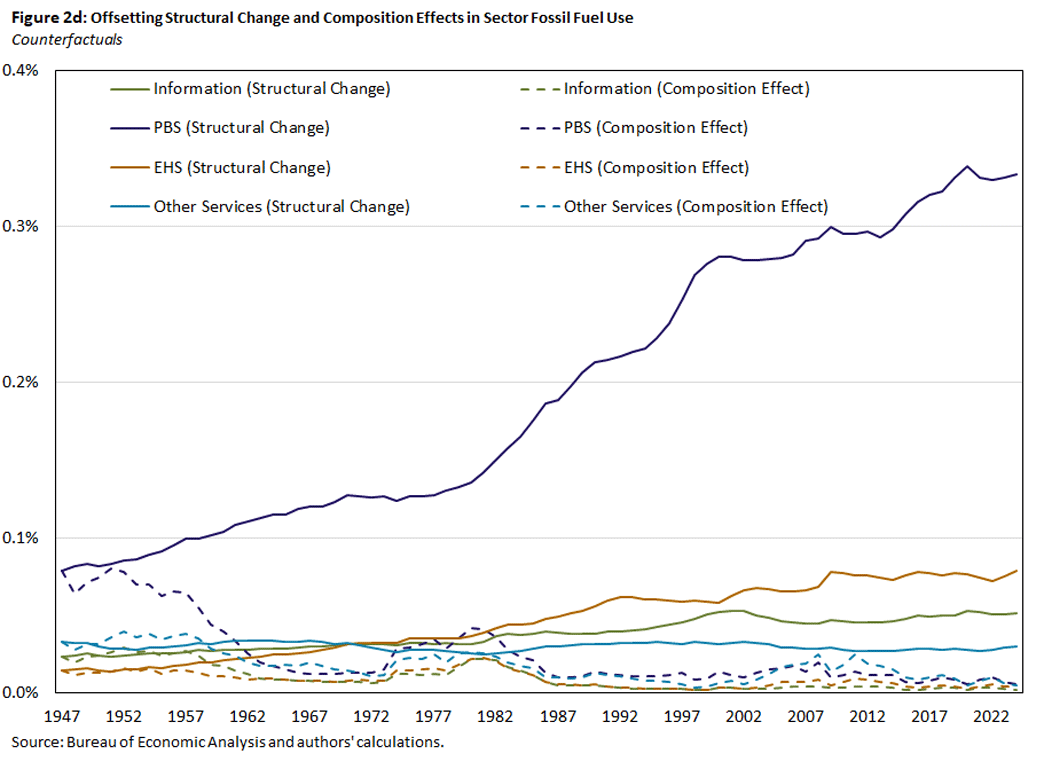
The interpretation of this plot is that, if not for the growing importance of these sectors, their use of fossil fuels would be much lower than it currently is. We can further surmise that one effect is stronger than the other for some sectors. In particular, the composition effect is stronger for information, PBS and other services, while the structural change effect dominates the EHS sector.
Dominant Effects
The second group is represented by the fossil fuels and retail trade sectors, shown in Figure 3.
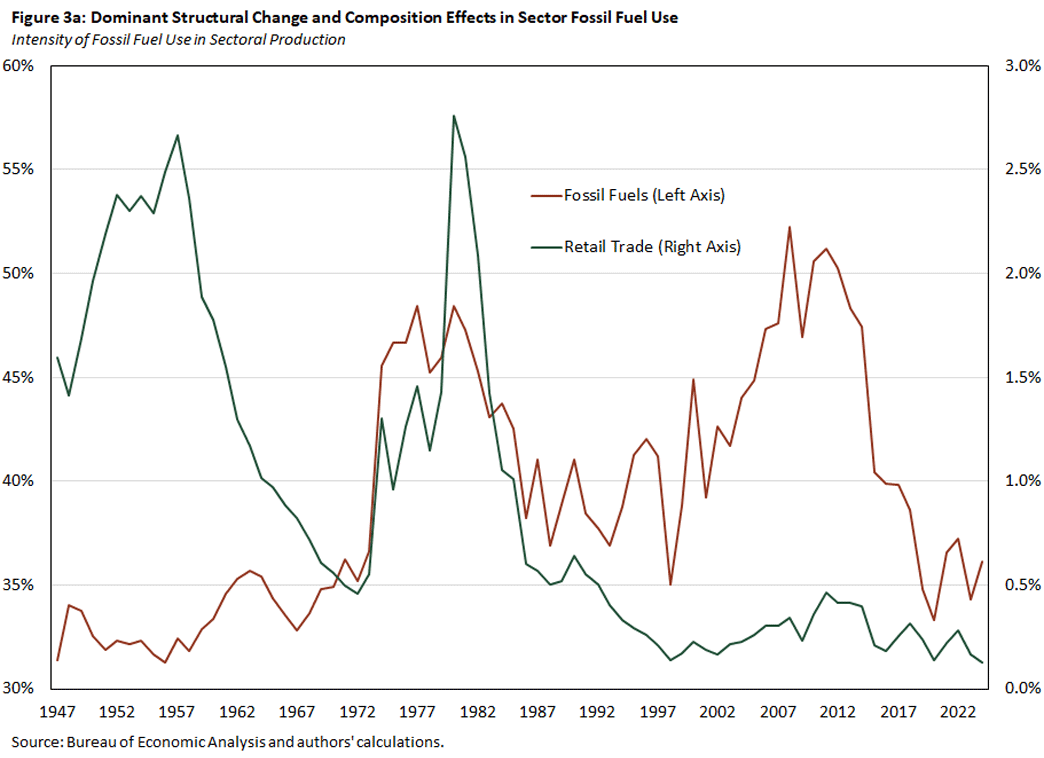
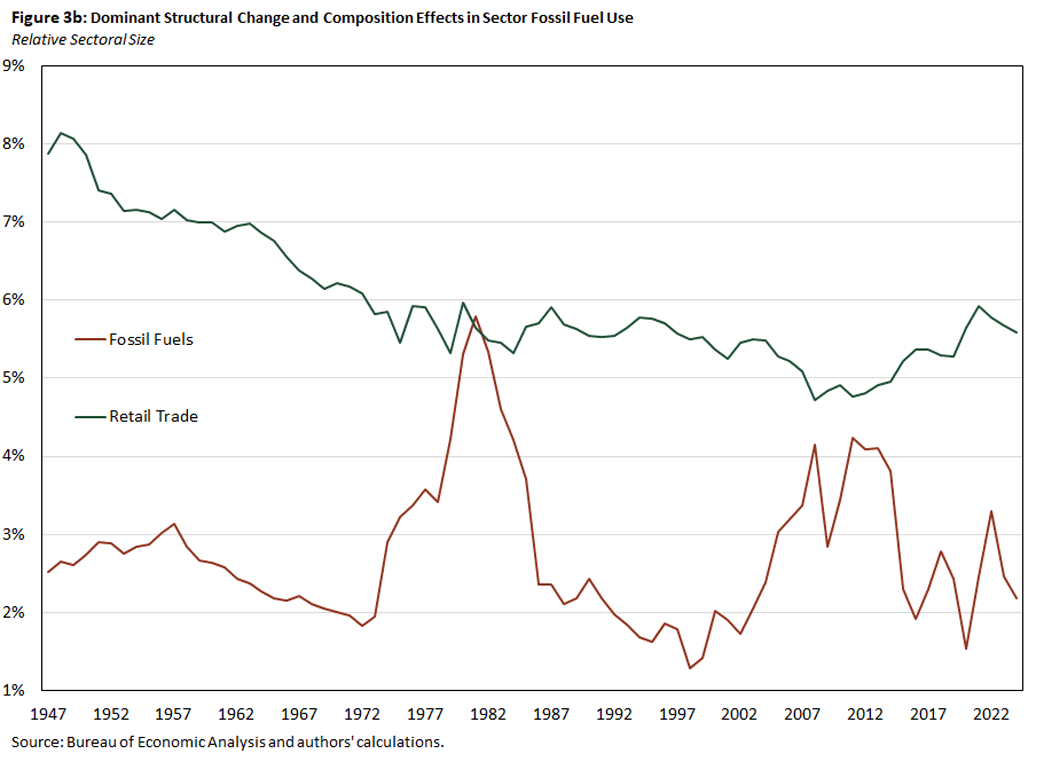

For both sectors, one effect dominates the other, with the structural change effect dominating composition in fossil fuels and vice versa in retail trade. Within the fossil fuels sector, we see that the intensity with which it uses its own output is modestly higher now than at the start of the period, while it occupies roughly the same share in gross output.
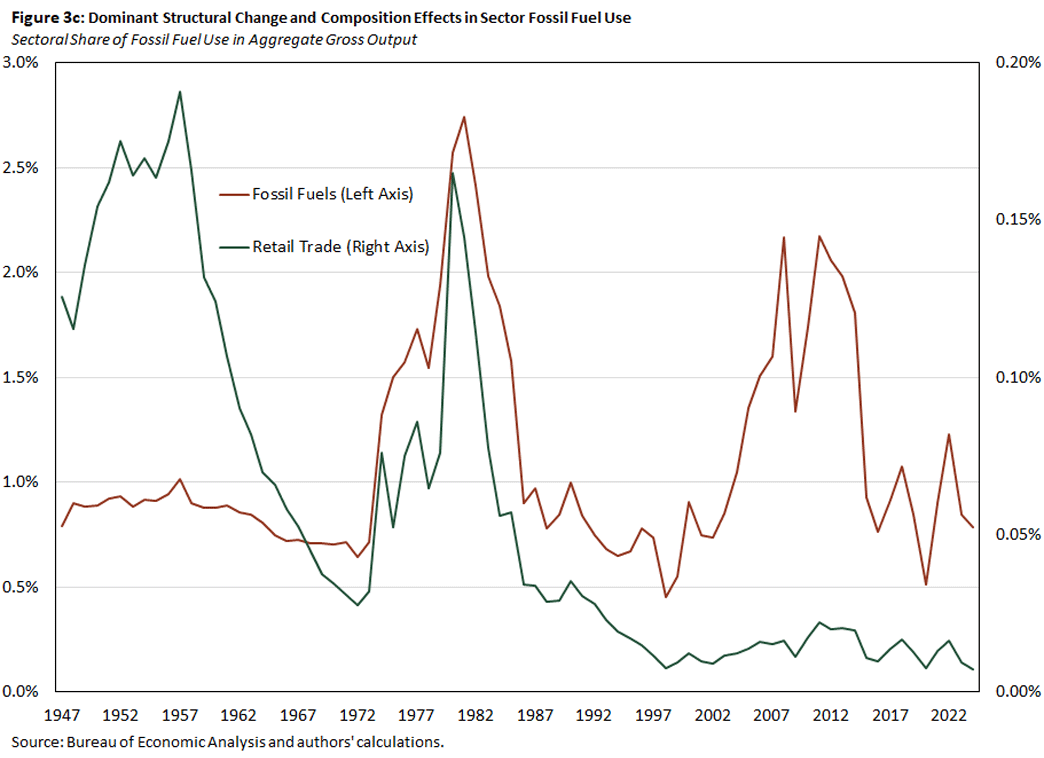
Upon decomposing this share, we see that there is really no composition effect. This is expected, as the fossil fuel industry uses roughly the same share of fossil fuels and intermediate inputs in production. The share matches the structural change effect almost exactly, showing that in a world where the proportion of fossil fuel inputs to total intermediate input usage in the fossil fuel sector was unchanged from 1947, the evolution of the fossil fuel sector's importance explains almost all of the change in its share of fossil fuel input usage in gross output.
On the other hand, retail trade exhibits almost no structural change effect. In a world where the retail trade sector produced the same share of gross output, its within-sector intermediate input dynamics gives almost exactly its aggregate share of fossil fuel usage. Taking note of the scale of the actual and counterfactual panels in Figure 3, we see that the counterfactual of no structural change provides almost exactly the same fossil fuel use in gross output share but at a slightly higher magnitude and that the structural change effect has only mildly attenuated this share over the period studied.
Tandem Effects
The final group is represented by the finance, insurance and real estate (FIRE) sector in Figure 4, where both structural change and input composition work together to drive the dynamics of fossil fuel use by the FIRE sector.
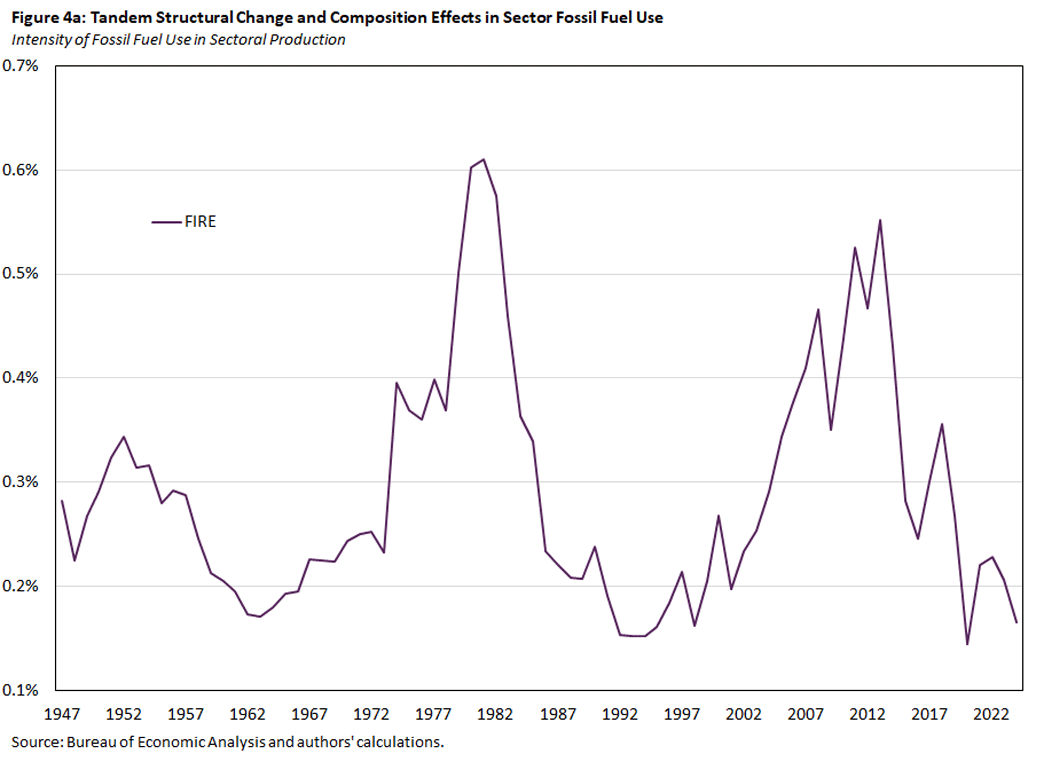
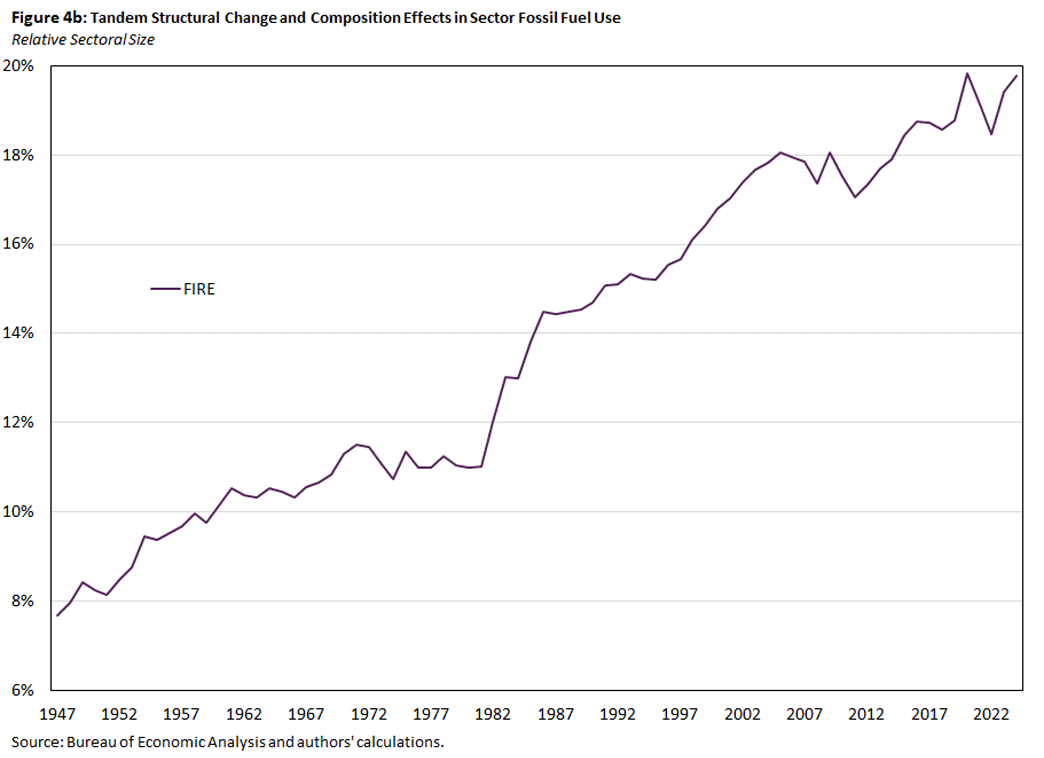
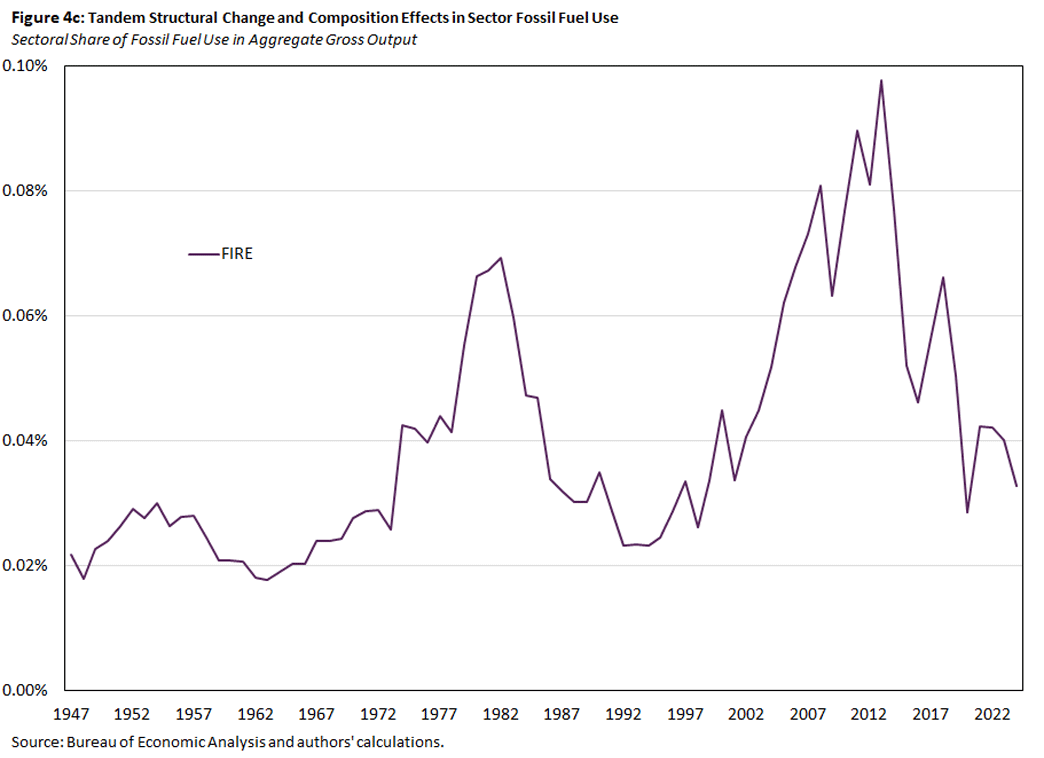
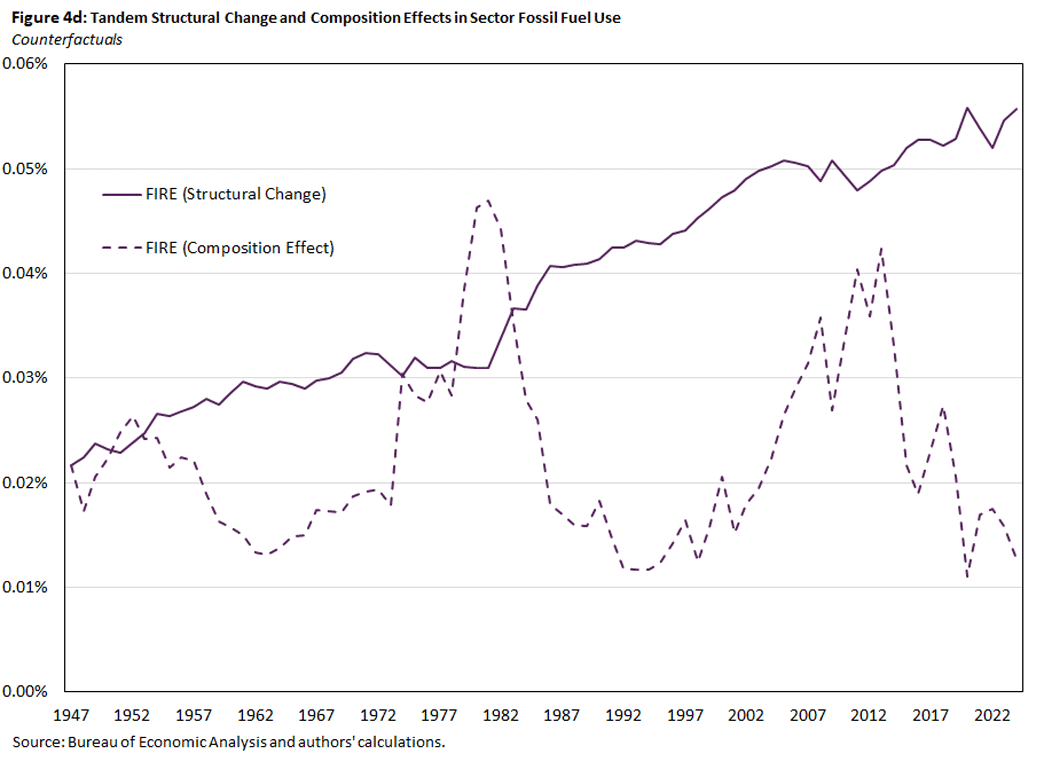
In particular, we find that the composition effect drives the behavior of the share (matching the spikes and end behavior), while the structural change effect acts like a trend, providing the gradual and consistent upward movement in the share. We can say then that the FIRE sector has not made any production choices to use less fossil fuels in its production while it has simultaneously grown in importance.
Conclusion
As seen in figures 1 and 3c, the fossil fuel sector accounts for roughly half of the aggregate usage of fossil fuels in gross output. A majority of what remains is represented by the first group of sectors we examined. This leads us to conclude that the aggregate use of fossil fuels in gross output has remained more or less constant for two reasons. First, the fossil fuel sector occupies a large share of gross output and uses a stable share of fossil fuels. Second, the sectors of information, PBS, EHS and other services have grown in size but become less dependent on fossil fuels.
In sum, policy discussions regarding fossil fuels should address two separate but important components:
- The large size and stable share of fossil fuel inputs in the fossil fuel sector
- The growing size of the information, PBS, EHS and other services sectors
These two components originate from two different sources: The size of the sector is a demand-driven phenomenon, while the composition effect is driven by investments that sectors have made in production. Therefore, policymakers will need to contend with growing demand for output from certain service sectors and the investments made within the fossil fuel industry to continue using fossil fuels as a primary input in its production of gross output.
Pierre-Daniel Sarte is a senior advisor, and Jack Taylor is a research associate, both in the Research Department at the Federal Reserve Bank of Richmond.
1
We'll use "sector" and "industry" interchangeably in this article.
2
Final demand is defined as the components of gross domestic product: imports, exports and public and private consumption and investment.
3
A detailed description of the process is given in the data appendix (PDF) to my (Pierre's) working paper "The Past and Future of U.S. Structural Change: Compositional Accounting and Forecasting," co-authored with Andrew Foerster, Andreas Hornstein and Mark Watson.
4
The "other services excluding government" sector corresponds to NAICS code 81, which includes services providing services not otherwise not classified elsewhere, such as repair, maintenance and personal services.
To cite this Economic Brief, please use the following format: Sarte, Pierre-Daniel; and Taylor, Jack. (July 2026) "How Much Does the US Economy Rely on Fossil Fuels?" Federal Reserve Bank of Richmond Economic Brief, No. 26-21.
This article may be photocopied or reprinted in its entirety. Please credit the authors, source, and the Federal Reserve Bank of Richmond and include the italicized statement below.
Views expressed in this article are those of the authors and not necessarily those of the Federal Reserve Bank of Richmond or the Federal Reserve System.
Subscribe to Economic Brief
Receive a notification when Economic Brief is posted online.
Contact Us