

What Unemployment Insurance Claims Can — and Cannot — Tell Us
Economic Brief
July 2026, No. 26-24
Key Takeaways
- Fewer people are losing their jobs: New claims for unemployment benefits are down, while the workforce covered by unemployment benefits has grown by 13 million since 2022.
- People aren't leaving the benefit rolls faster: The weekly exit rate has been flat near 11.7 percent since early 2025 — which is a quarter below its 2022 level — and a typical insurance spell now runs 8.2 weeks versus 6.5 weeks in 2022.
- The recent decline in continuing claims is not necessarily evidence of a recovering labor market. It is explained almost entirely by fewer arrivals, not faster exits. And the share of claimants leaving because they ran out of benefits (rather than because they found work) has more than doubled, from 3.3 percent of all exits in 2022 to 7.3 percent over the 12 months through June 2026.
Every Thursday morning, the Department of Labor publishes two numbers about unemployment insurance: initial claims and continuing claims. Over the past year, the number of people filing new claims has been flat to falling, while the number of people drawing benefits week after week climbed steadily through the summer of 2025 and has since fallen back.
Read casually, the recent pattern looks reassuring: Fewer people filing, fewer people collecting. But the two series measure different things, and the second one is falling for a reason that should cause concern. This article explains what these numbers can and cannot tell us about the labor market and why the distinction matters right now.
What the Unemployment Numbers Actually Count
It is important to note that initial claims and continuing claims are not two versions of the same measurement. One counts new arrivals to unemployment insurance, while the other counts everyone currently present. The difference between them is not itself a meaningful quantity, but combining them yields an important measurement: the speed at which people leave the unemployment rolls.
What the Claims Show: Two Phases, Opposite Causes
Continuing claims rose by 560,000 between July 2022 and August 2025 then fell by 149,000 from August 2025 through June 2026. So, what drove each move: the number of people arriving in unemployment or the number of people leaving?
The answer differs by phase, and the reversal is the heart of the story. Figure 1 shows how continuing claims have evolved since 2022 and projects how claims would have fared if the arrival rate or the exit rate had been held fixed. Each counterfactual is run separately for the two phases:
- For the rise, the fixed margin is held at its 2022 average.
- For the decline, the fixed margin is held at its mid-2025 average, restarting from the observed level of claims at the August 2025 peak.
The visible break in the counterfactual lines at the August 2025 data point is the reinitialization of the decline. Thus, it is a feature of the exercise and not a movement in any observed series.
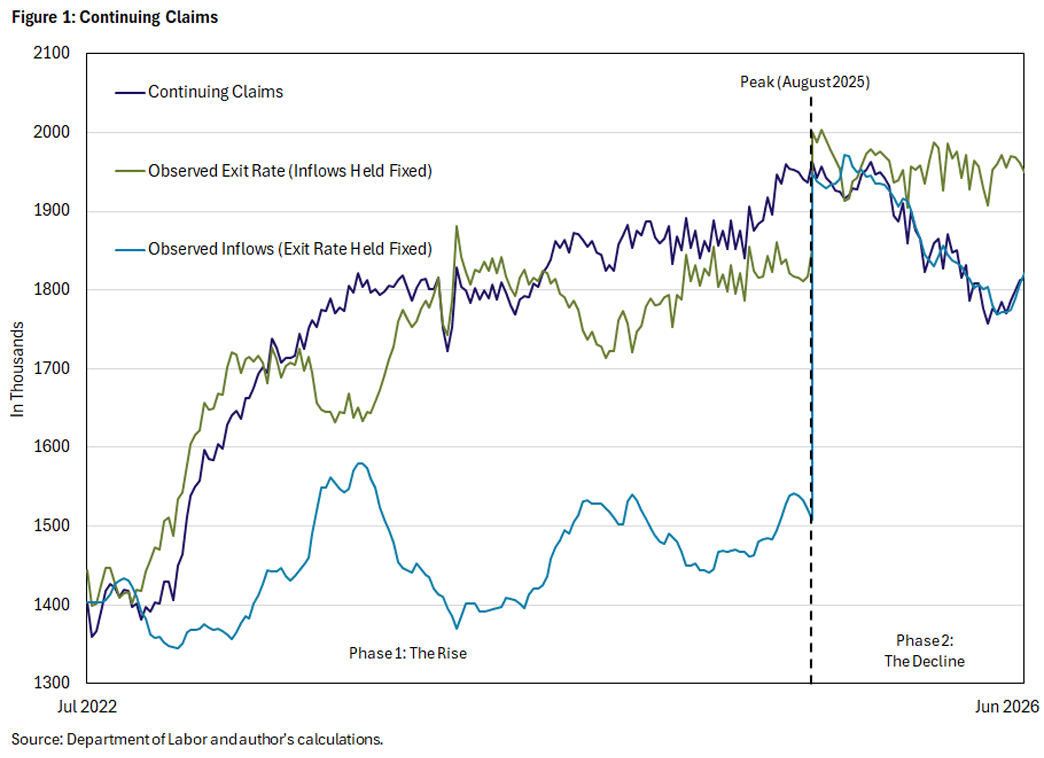
The initial rise was about exits. When arrivals are held at their 2022 average but the exit rate that was actually observed is used, the model reproduces 451,000 of the 560,000 increase. If the exit rate is held fixed instead, it reproduces only 105,000. People were not flooding in but were instead failing to leave.
However, the subsequent decline is about arrivals. When the exit rate is held at its mid-2025 level and observed arrivals are used, the model reproduces 142,000 of the 149,000 decline. Hold arrivals fixed instead, and it reproduces only 14,000.
Finally, the exit rate never recovered. It was 11.8 percent per week at the August 2025 peak, and it was 11.7 percent in the first half of 2026. In 2022, it was 15.2 percent.
In other words, the number that improved is the one measuring how many people arrive in unemployment. The number that did not improve is the one measuring how long they stay. Continuing claims are falling because there are fewer newly unemployed people, not because unemployed individuals are having an easier time finding jobs.
Where Claimants Actually Go
There are three ways to stop drawing unemployment benefits: Find a job, stop claiming benefits without finding one (and just give up searching), or simply fall out of the system. In the third case, one can fall out of the system by reaching the end of a state's benefit window and getting cut off, regardless of whether a job has been secured or if the job search is ongoing.
The claims data alone cannot separate these three, but linking them to Current Population Survey microdata on job losers can. The result is concerning. First, every route out of the rolls has slowed except one. As seen in Figure 3, leaving for a job fell from 9.1 percent of claimants per week (averaged over 2022) to 6.8 percent (averaged over the 12 months ending in June 2026), and leaving without a job fell from 5.3 percent to 4.2 percent. However, running out of benefits rose, from 0.5 percent to 0.9 percent.
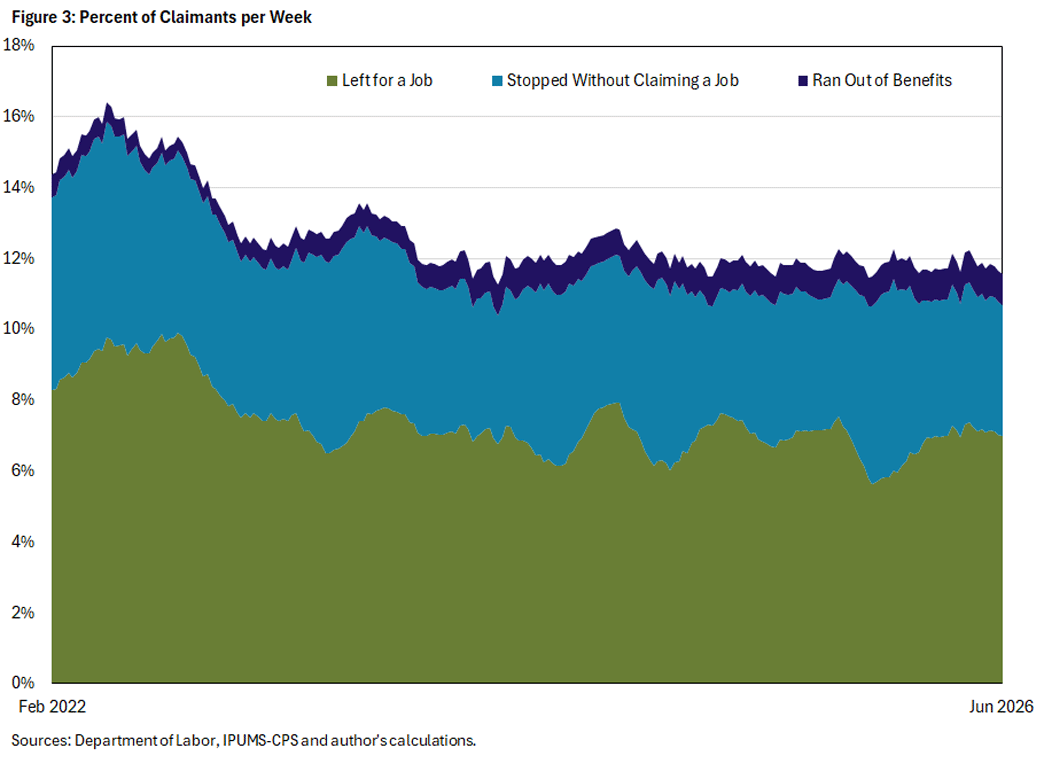
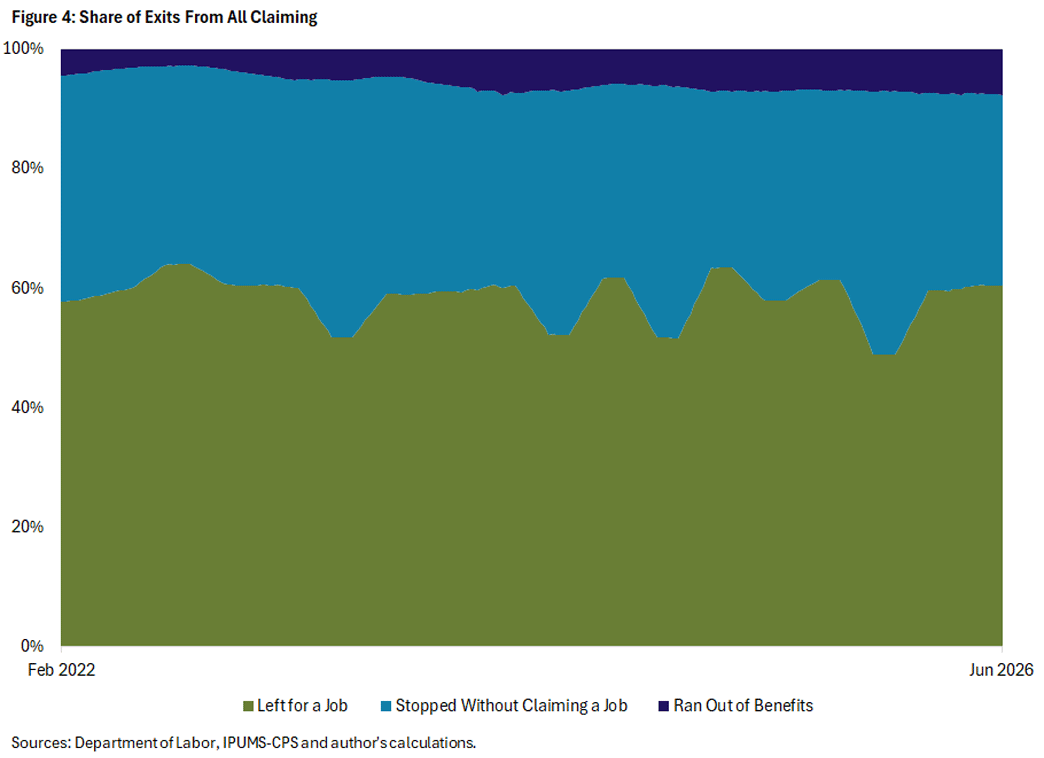
Figure 4 displays the shares for the reasons claimants exit. The only route gaining ground was benefit exhaustion, which went from 3.3 percent of all exits in 2022 to 7.3 percent over the 12 months through June 2026.
About 6 percent of claimants a month stop claiming without leaving unemployment. They have neither found work nor been counted as having exhausted benefits. The insured data simply lose track of them.
The Blind Spot
A challenge with the data is that continuing claims cannot, by construction, count anyone who has been unemployed longer than their state allows benefits. When people hit their state cap, they leave the count not because their situation improved but because their eligibility ended.
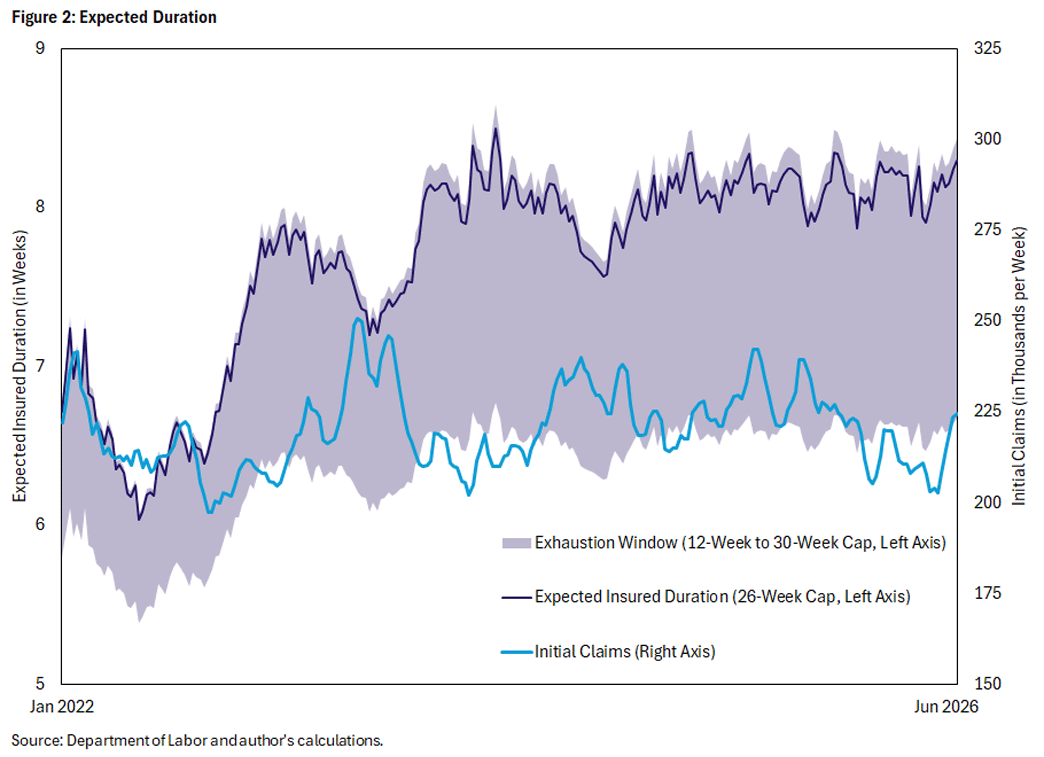
Thus, the measure fails precisely when it's needed most for examining exits from long-term unemployment. A slower exit rate pushes more people to the cap, and more people hitting the cap means more people dropping out of the count. So, the count understates long-duration unemployment, with the understatement growing as conditions worsen. The 8.2-week data point from Figure 2, thus, should be read as a floor not an estimate.
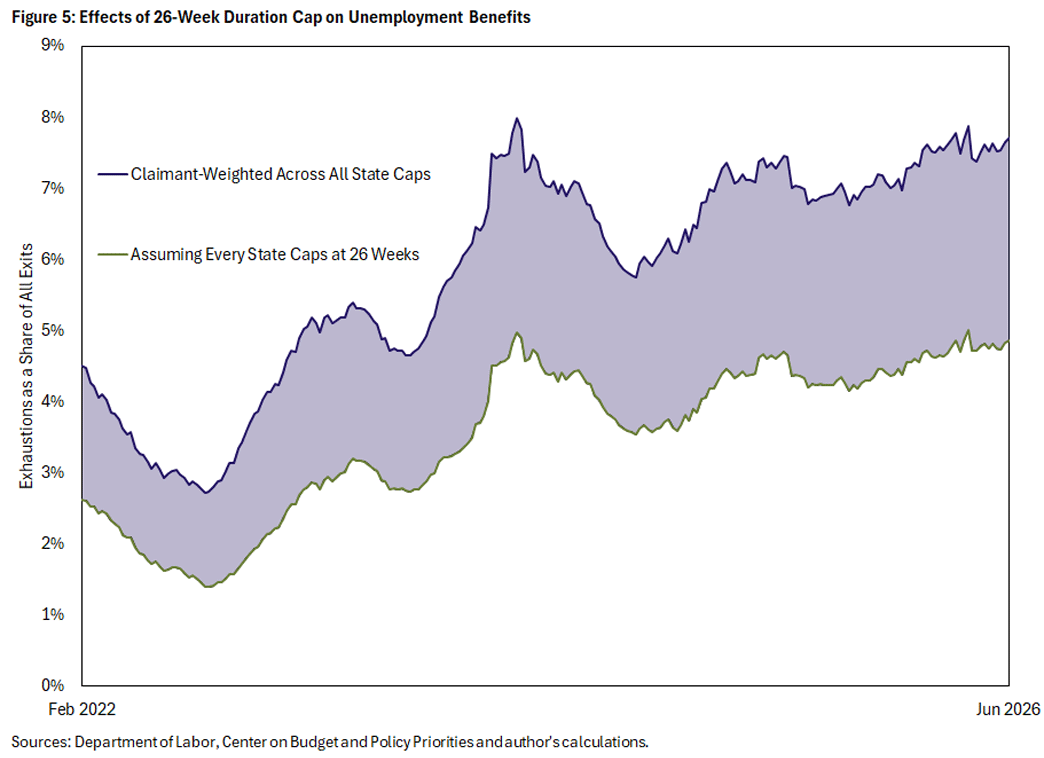
However, the benefit window is not the same everywhere, and that matters considerably. Benefits are capped below 26 weeks in 16 states. Five states stop at 12, and nearly half of all exits from their rolls are exhaustions. Those claimants are only about 4.5 percent of the national total — restrictive states have fewer claimants precisely because they are restrictive — but they weigh heavily on the national picture. As shown in Figure 5, assuming a uniform 26-week cap would put exhaustion at 4.5 percent of exits, while accounting properly for the mix of caps puts exhaustion at 7.3 percent, both averaged over the 12 months through June 2026. (Note than the plotted lines sit somewhat higher at the right edge because both series were still rising within that window.)
There is a further wrinkle that may cause the data to underrepresent the issue. Even in the states with a 26-week maximum, most set each person's actual entitlement on a sliding scale tied to their earnings history, and the scale works against those with the weakest attachment to the labor force. Workers with shorter or more irregular work histories qualify for fewer than 26 weeks. Only nine jurisdictions grant a uniform 26 weeks to everyone. So even the 7.3 percent figure is, if anything, too low.
Two further limits are worth stating. Only about one-quarter to one-third of unemployed people draw benefits at all, so these data describe a particular slice — job losers with sufficient earnings history — and not the unemployed in general. And as any group of claimants ages, the people who were going to find work quickly have already done so. The aggregate exit rate falls somewhat for that reason alone, without any deterioration in anyone's individual prospects.
What to Watch
In summary, there are three items that merit closer ongoing examination:
- The exit rate, not the level. A falling continuing-claims number tells little on its own. The question is whether it is falling because people are leaving unemployment faster or because fewer are arriving. Fewer arrivals is genuinely good news, as it means fewer layoffs and can in principle also reflect people finding work so quickly that they don't draw a second week of benefits. But with the exit rate flat, a falling count likely means fewer people are entering a pool that remains just as hard to leave.
- The 27-plus weekly unemployment count from the household survey. This measure does not have an eligibility cliff. If the claims-side story is right, it should keep rising even as continuing claims fall.
- The Department of Labor's exhaustion rates. These directly count the people the continuing-claims series is dropping.
The labor market of mid-2026 is one in which it has become less likely to lose a job but more costly if it happens. The weekly claims data capture the first of those facts clearly and the second only obliquely, which is another reason why the second deserves attention.
Claudia Macaluso is a senior research economist in the Research Department at the Federal Reserve Bank of Richmond.
To cite this Economic Brief, please use the following format: Macaluso, Claudia. (July 2026) "What Unemployment Insurance Claims Can — and Cannot — Tell Us." Federal Reserve Bank of Richmond Economic Brief, No. 26-24.
This article may be photocopied or reprinted in its entirety. Please credit the author, source, and the Federal Reserve Bank of Richmond and include the italicized statement below.
Views expressed in this article are those of the author and not necessarily those of the Federal Reserve Bank of Richmond or the Federal Reserve System.


Subscribe to Economic Brief
Receive a notification when Economic Brief is posted online.
Contact Us