

Market Power Rose, Why Didn't Profits?
Economic Brief
September 2026, No. 26-32
Over the past six decades, the power of American firms to charge prices above their production costs — which economists call "market power" — has grown. In 1960, prices averaged about 10 percent above the cost of producing an additional unit of output. By 2020, that gap had widened to 25 percent. One might expect those widening margins to show up as a lasting rise in the share of gross domestic product (GDP) flowing to profits. They did not, as profits have averaged about 16 percent of GDP since 1960 and have fluctuated widely but without a lasting upward trend.
The gap between the price and the cost of one additional unit is what economists call a markup, and a high markup does not by itself imply a high profit. A software firm's offering illustrates the distinction. Writing the code, building and maintaining the platform, and advertising the product require large up-front expenditures, while serving one more customer costs almost nothing, so nearly every dollar of every license is markup. Thus, that high markup is not pure profit, since the business must use it to recover the fixed costs associated with simply being in business.
In our recently updated 2023 working paper "The Micro-Aggregated Profit Share," we measure markups and profits for thousands of U.S. firms between 1956 and 2024. We find that rising markups have not produced a lasting rise in profits, for a reason the software firm example makes intuitive: The fixed bills those markups must cover have grown alongside them. What looks like six decades of accumulating pricing power has been met by an offsetting force: the rising cost of simply being in business.
Market Power Has Been Rising
Our evidence comes from the financial statements of about 21,000 publicly traded U.S. firms between 1956 and 2024. For each industry and year, we estimate how production costs move with output, and we combine those estimates with each firm's own financial statements to obtain a markup for every firm. We then aggregate the firm-level markups into an economy-wide average using a method that is consistent with the way national accounts add up income. As an external check on the framework, the share of income going to workers implied by our estimates closely tracks the official labor share, even though nothing in our procedure targets it.
The resulting series shows a clear rise in market power — with most of the climb coming after 1980 — though the path is not a straight line: Markups started at about 10 percent above cost in 1960, dipped through the 1970s, climbed over the next quarter-century to a peak of roughly 34 percent in 2007, fell sharply in the years after the Great Recession and have since recovered to about 25 percent.
Readers familiar with this debate may recall considerably larger numbers when discussing markups. The influential 2020 study "The Rise of Market Power and the Macroeconomic Implications" — authored by Jan De Loecker, Jan Eeckhout and Gabriel Unger — reported markups rising from 20 percent above cost in 1980 to 60 percent in 2016. However, we find an increase from 8 percent to 17 percent over the same window. (These endpoints sit below our 1960 and 2020 figures because of the dip through the 1970s and a steep climb after 2016.) The difference between the two studies is mainly due to how firm-level markups are combined into an economy-wide average and how costs are classified, which are measurement choices we examine at length in our paper. The qualitative message survives either way: Market power in the U.S. has risen meaningfully.
A Changing Cast of Firms
It is tempting to read a rising markup as firms across the economy charging more and pocketing the difference. However, that is not what happened, according to our study.
How the markup actually rose is the first clue as to why profits did not follow. The markups of firms in business throughout the period did not rise. (If anything, they edged down.) The economy-wide markup rose instead because high-markup firms came to account for a growing share of sales. Most of that shift — roughly 65 percent of the increase — took place among firms already in business. The remaining 35 percent came from turnover, as entrants tended to charge higher markups than the firms they replaced.
The distribution of markups has fanned out accordingly, as seen in Figure 1. A firm at the 90th percentile charged prices about 40 percent above the cost of an additional unit in 1960 and about 140 percent above in 2020. The median firm moved far less, from 7 percent to 21 percent above cost. Even that rise should not be read as firms raising their prices: A percentile marks a position rather than a firm, and the firm in the middle of the distribution in 2020 is not the firm that was there in 1960.
At the bottom, pricing power deteriorated outright: A firm at the 10th percentile charged roughly 7 percent below the cost of producing one more unit in 1960 and roughly 24 percent below by 2020. Selling below cost is not sustainable, and these firms may be near exit, absorbing temporary losses or pricing below cost to drive rivals from the market (a practice antitrust law calls predatory pricing).
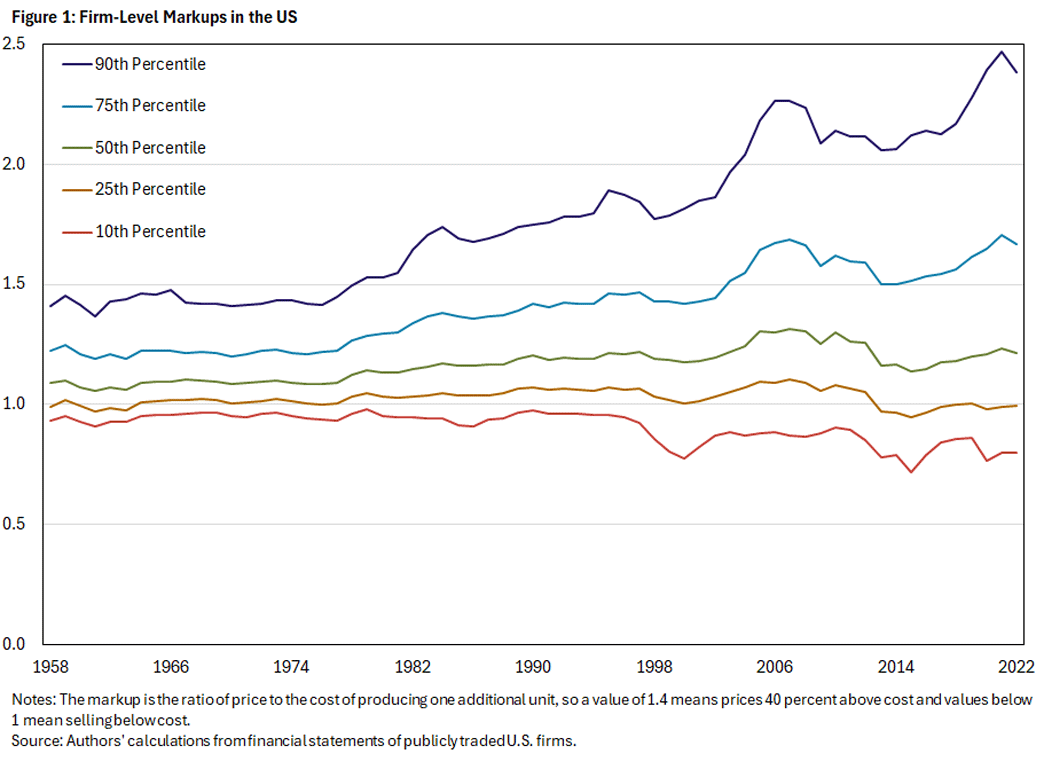
Markups, in short, did not rise across the board. Instead, they concentrated. Any firm would charge more if it could; what normally stops it is competition. Thus, the questions are: What has allowed one group of firms to sustain margins this large, and why haven't rivals entered to compete them away?
Profits Did Not Keep Pace
The answers begin with profits. Rising market power should have made American firms more profitable, and it actually did for stretches of a decade or two. But over six decades, it did not. Profit, properly understood, is what remains after a firm pays for labor, materials and the full cost of capital, including the return investors could have earned elsewhere. Defined in this manner, profits have averaged about 16 percent of GDP since 1960. For the average firm, that works out to about 8 cents of profit on every dollar it sells. The figure is lower than 16 cents because firms sell to one another, so the economy's total sales add up to roughly twice its GDP.
Profit share has swung widely. It hovered near 10 percent of GDP through the 1980s, climbed alongside markups through the 1990s and 2000s to a peak of roughly 30 percent in 2007, and then gave that climb back in the years after the Great Recession before recovering recently. What the series lacks is a lasting rise: Profit share ended the period fluctuating around its six-decade average and far below the 2007 peak, even though markups remained far above their 1960 level.
The mismatch between rising market power and a profit share with no lasting rise sharpens once we isolate market-power rents, or the income that firms collect by pricing above cost. Those rents roughly tripled over the period, from about 12 percent of GDP to about 35 percent. (Rents can loom larger than the 25 percent markup might suggest for the same reason as above: Total sales are roughly twice GDP.) If rents tripled while the profit share did not, something large must have eaten most of the difference.
The Resolution: the Rising Cost of Being in Business
The answer is the rising cost of being in business: overhead a firm must pay no matter how much it sells, together with a shift toward ways of producing that require more spending up front before the first unit is sold, as the rise of the IT industry illustrates. Overhead consists of the costs of running the business, such as advertising, accounting, administrative functions, managerial functions and regulatory compliance. Recall the software firm from the opening: Its large markups exist to pay bills that do not depend on how many units it sells. By our estimates, the resources absorbed by fixed costs and changing production technology rose from about 3 percent of GDP in 1960 to about 16 percent in 2020. That increase offset most of the rise in market-power rents, leaving the profit share fluctuating around its long-run average rather than keeping pace with them, as seen in Figure 2.
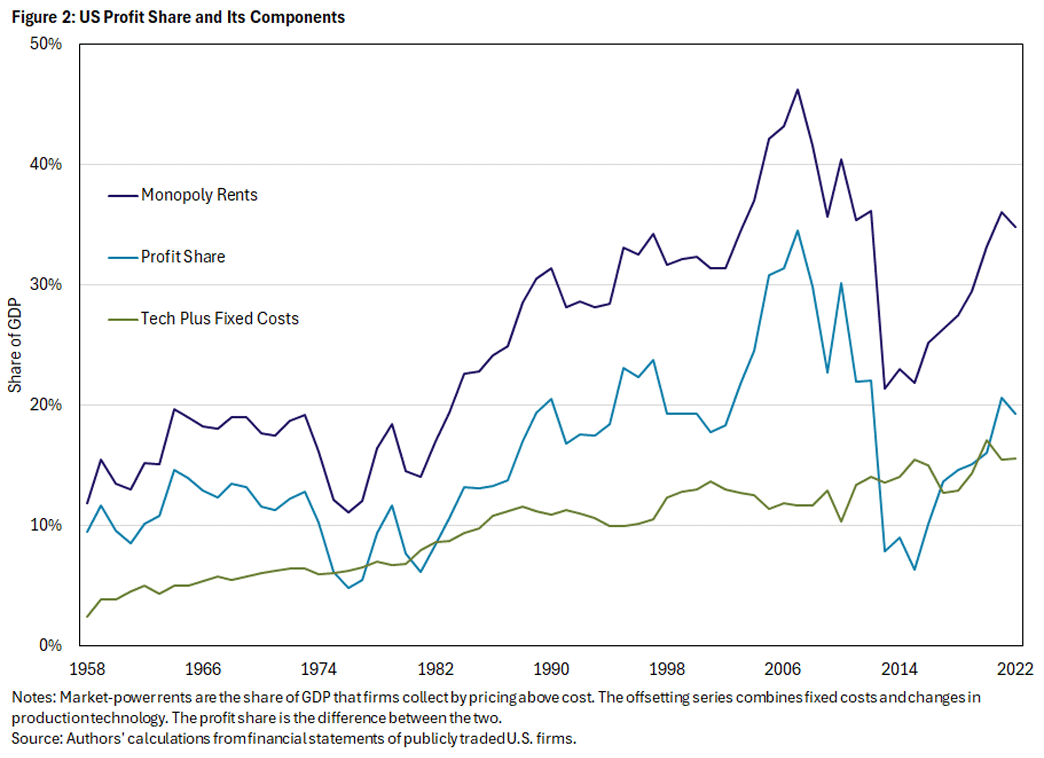
The offset is no coincidence, as the two trends are connected. Rents from pricing above cost survive only when something keeps competitors from entering and competing them away. Rising overhead is that something. A firm must now clear a much larger fixed bill before earning its first dollar of profit, which deters entrants, squeezes incumbents whose margins cannot cover the bill and tilts the economy's sales toward the high-markup firms that can. The growing group of firms selling below cost that we described earlier may be that squeeze made visible: firms being pushed toward the door. The firms that remain charge higher markups, and the proceeds go to overhead, not to profit.
Seen this way, the rise in markups is largely the price of admission going up rather than the prize getting bigger. American firms charge more over cost than they did 60 years ago, but being an American firm also costs far more than it did 60 years ago, and the two variables have largely risen together.
Potential Implications for Competition Policy
Our analysis is a measurement exercise: It documents what happened to markups, costs and profits, and it does not estimate the effects of any policy. But the measurement itself carries lessons for how to read the evidence in competition policy debates.
The first lesson is about diagnostics. Taken alone, a high markup is weak evidence of harm from market power, because a high markup at a firm with heavy fixed costs may translate into little or no profit. Profits are the more informative object, and the past six decades show that the two can diverge: Markups rose substantially, while the profit share did not keep pace.
The second lesson is about cost structure. Policies that compress markups without accounting for fixed costs could have very different effects across firms. For firms with high fixed costs, lower markups may leave too little to cover the cost of operating. For firms with persistently high profits, by contrast, high markups may point to barriers that protect rents rather than to costs that need to be recovered. Distinguishing between these cases requires looking jointly at markups, profits and entry barriers, as markup evidence alone cannot make the distinction.
The third lesson is about uniformity. With prices ranging from 24 percent below cost at the 10th percentile of firms to 140 percent above at the 90th, any uniform rule will land on firms in radically different positions. If firms at the bottom of the distribution are already near breakeven, an intervention calibrated to the average could, in principle, trim rents at one end while pushing the other end out of the market.
None of this means market power is benign. Market-power rents tripled, and rents that large can persist only behind real barriers to entry. Rather, our findings redirect attention from the symptom (markups) to the barrier itself: the rising fixed cost of being in business, including the parts of that cost (such as compliance burdens) that policy itself creates.
Conclusion: Watch Profits, Not Markups
Market power in the U.S. has been rising for 60 years, and it has risen in a particular way: not through across-the-board price increases, but through a changing cast of firms. And the economy's profit share has not followed, because most of the winnings have been absorbed by the rising costs of operating.
For competition policy, the lesson is not that markups do not matter. They do, as rising markups show firms selling further above cost than they once did. But our evidence suggests that the right question is not "Are markups high?" but "Are profits persistent, and what barrier protects them?"
Thomas Hasenzagl is an economist in the Research Department at the Federal Reserve Bank of Richmond. Luis Perez is an assistant professor of economics at Southern Methodist University.
To cite this Economic Brief, please use the following format: Hasenzagl, Thomas; and Perez, Luis. (September 2026) "Market Power Rose, Why Didn't Profits?" Federal Reserve Bank of Richmond Economic Brief, No. 26-32.
This article may be photocopied or reprinted in its entirety. Please credit the authors, source, and the Federal Reserve Bank of Richmond and include the italicized statement below.
Views expressed in this article are those of the authors and not necessarily those of the Federal Reserve Bank of Richmond or the Federal Reserve System.


Subscribe to Economic Brief
Receive a notification when Economic Brief is posted online.
Contact Us