How Much More Are Drivers Paying for Gas?
Macro Minute
June 2, 2026
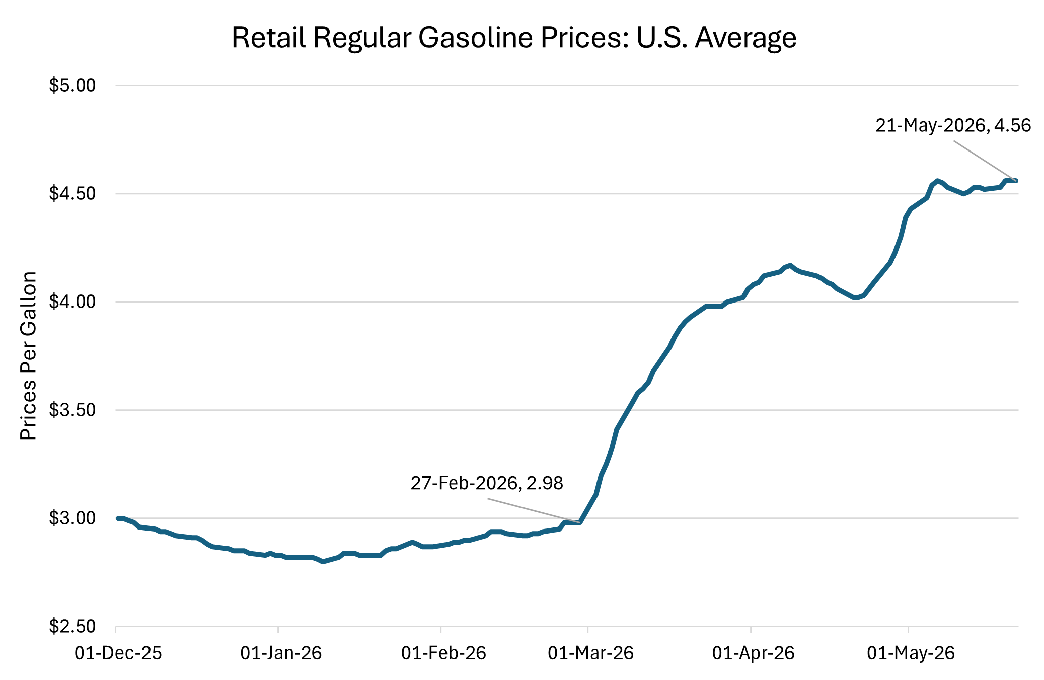
According to the AAA, national average gasoline prices reached a four-year high of $4.56 per gallon going into the Memorial Day weekend. As shown in Figure 1, gas prices are over $1.50 higher than they were before the start of the recent Middle East conflict. This week's post presents back-of-the-envelope calculations to assess the potential additional annual cost burden on the average driver from the recent increase in pump prices.
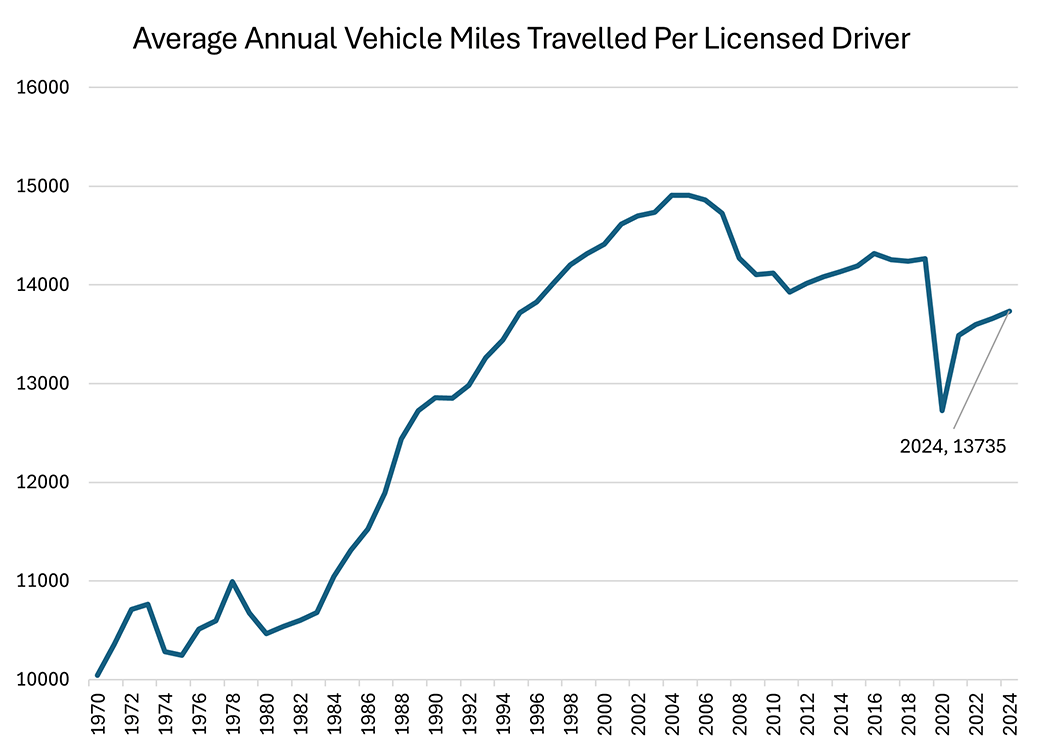
Quantifying how much gasoline prices affect average drivers requires first figuring out how much they drive. Figure 2 shows the latest data on total vehicle miles travelled and licensed drivers from the Federal Highway Administration. The average licensed driver drove 13,735 miles in 2024, up 0.5 percent over the previous year and 7.9 percent over its 2020 pandemic low.
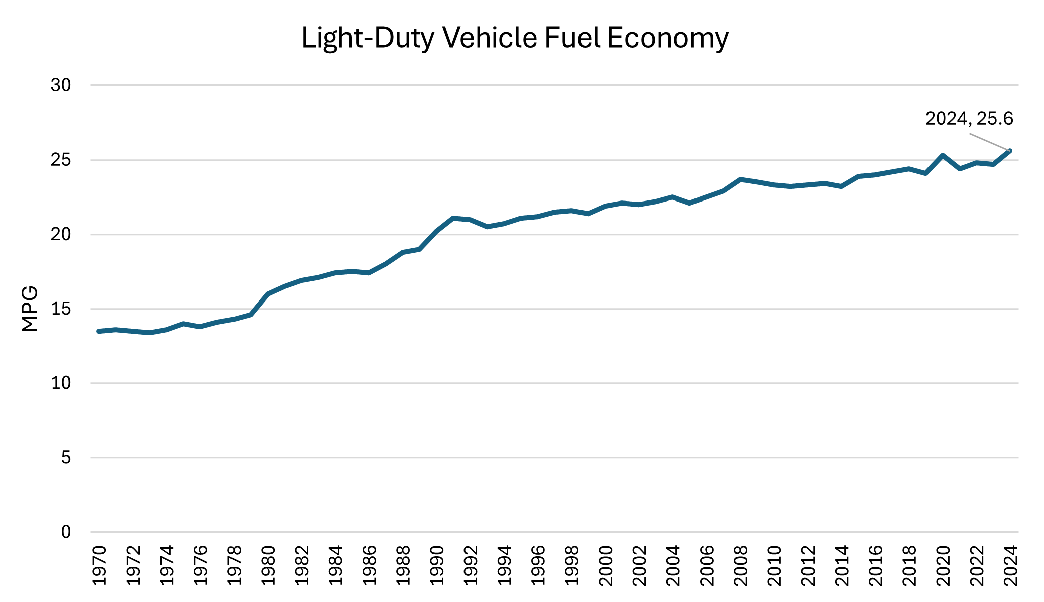
How much gasoline does the average driver consume to travel these 13,735 miles? Based on data from the Energy Information Administration, the national average fuel economy for light-duty vehicles — which include passenger cars, pickup trucks, vans, sport utility vehicles and crossover vehicles — was 25.6 miles per gallon as of 2024, rising over time as federal government fuel economy standards have become more stringent. Combined with Figure 1, this implies that the average driver consumes about 536.6 gallons (13,735 miles/25.6 miles per gallon) of gasoline per year.
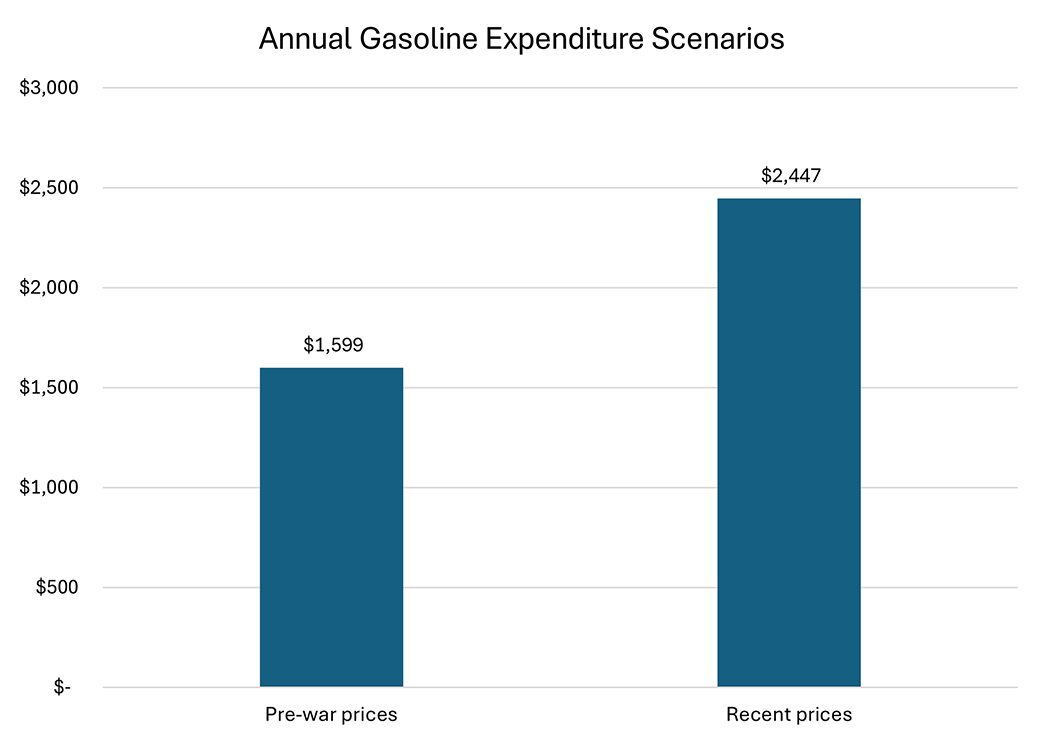
If gasoline prices were constant at their Feb. 27 prewar price of $2.98 per gallon, drivers would have spent $1.598.84 on their yearly consumption of 536.6 gallons of gasoline. At the average price of $4.56 per gallon observed on May 21, it would cost $2,446.55 to purchase the same amount of gasoline, an increase of $847.71 per year, or 53 percent.
This added burden represents a potentially significant strain to U.S. household finances. The Federal Reserve Board of Governors' Economic Well-Being of U.S. Households in 2025 report issued on May 13 finds that over one-third of adults lacked a sufficient cash (or cash-equivalent) buffer to cover a hypothetical $400 emergency expense. The recent gasoline price increase, if it persists for a year, would create a burden over twice as large as that hypothetical scenario unless commuters further curtail their driving (which is already below pre-COVID levels).
Views expressed in this article are those of the author and not necessarily those of the Federal Reserve Bank of Richmond or the Federal Reserve System.
Contact Us