A JOLTing Labor Market Situation?
Macro Minute
March 24, 2026
The January reading of the Job Openings and Labor Turnover Survey (JOLTS) contained more evidence of the current low hiring, low firing and low quits equilibrium in the labor market, a state which Fed Chair Jerome Powell once called "a curious kind of balance." The hiring rate was 3.3 percent in January, unchanged from its year ago reading, down 0.3 percentage points from January 2024 and down 0.8 percentage points from January 2023. Meanwhile, the separation rate (which includes firings as well as quits) was 3.2 percent compared to 3.3 percent a year ago and 3.4 percent two years ago.
By itself, the combination of low hiring and low separations may not necessarily raise concerns, so what makes some economy watchers uneasy about the current labor market? That is the topic of this week's post.
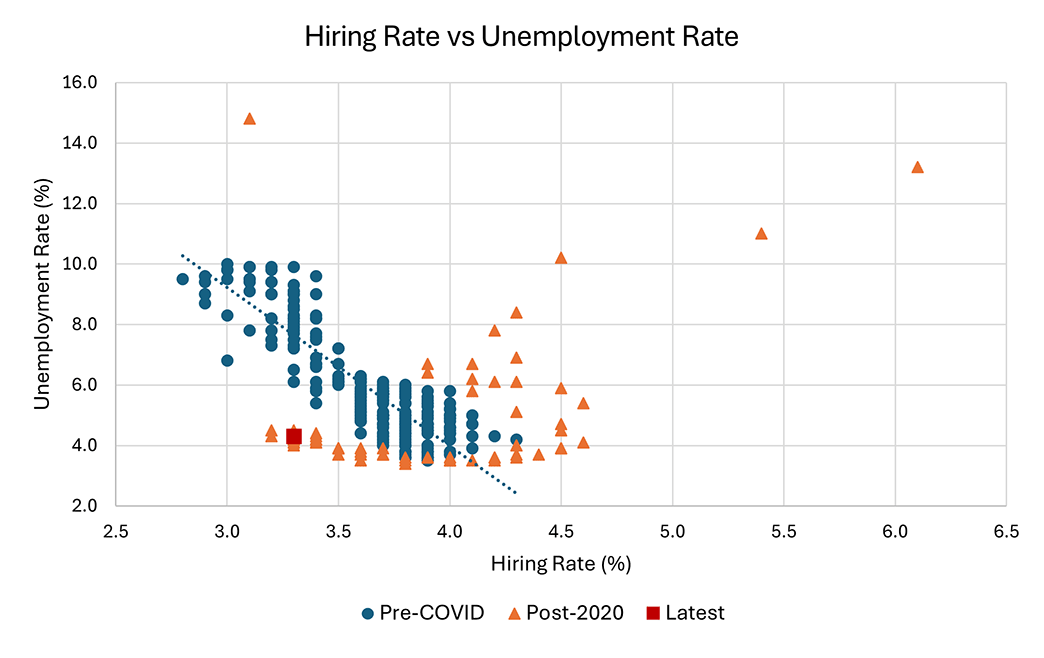
A reason one might interpret a low hiring rate as a sign of potential labor market fragility is its historical inverse correlation with the unemployment rate. Prior to the pandemic, there was a strong negative relationship between the hiring rate and the unemployment rate. Figure 1 below plots the prepandemic observations of both series in blue dots and the prepandemic linear trend in the blue dotted line. In contrast, in the post-February 2020 readings denoted in the figure by orange triangles, the two series diverged from this historical pattern. The latest January observation is denoted by the red square in the figure. Extrapolating the prepandemic relationship, the latest hiring rate of 3.3 percent would have been associated with an unemployment rate between 6 percent and 10 percent, much higher than the 4.3 percent unemployment rate recorded in January 2026.
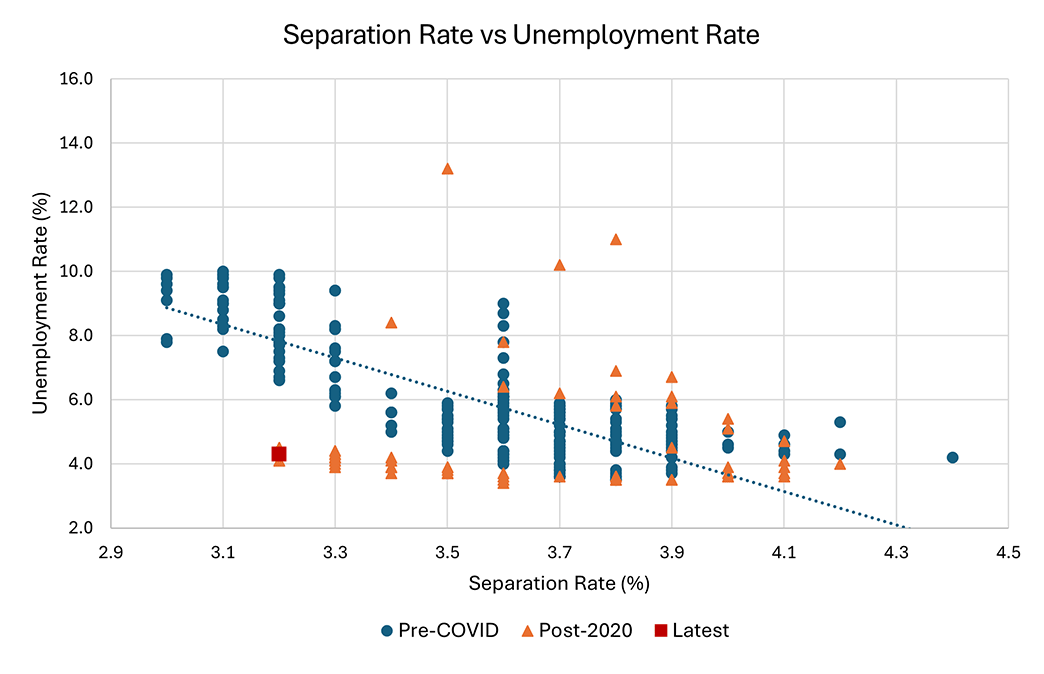
Similarly, the separation rate and the unemployment rate were negatively correlated before the pandemic, as shown in Figure 2 below. While this inverse relationship may seem strange, it is largely driven by the quits component of separations. Quits are typically higher than layoffs (about 60 percent higher over the full history of the JOLTS series), and workers feel more empowered to change jobs when the labor market is tighter (and the unemployment rate is low), driving up the quits and total separation rates. As in the previous figure, using the pre-COVID-19 relationship between the separation rate and the unemployment rate as a benchmark, January's separation rate of 3.2 percent would have been associated with a much higher unemployment rate.
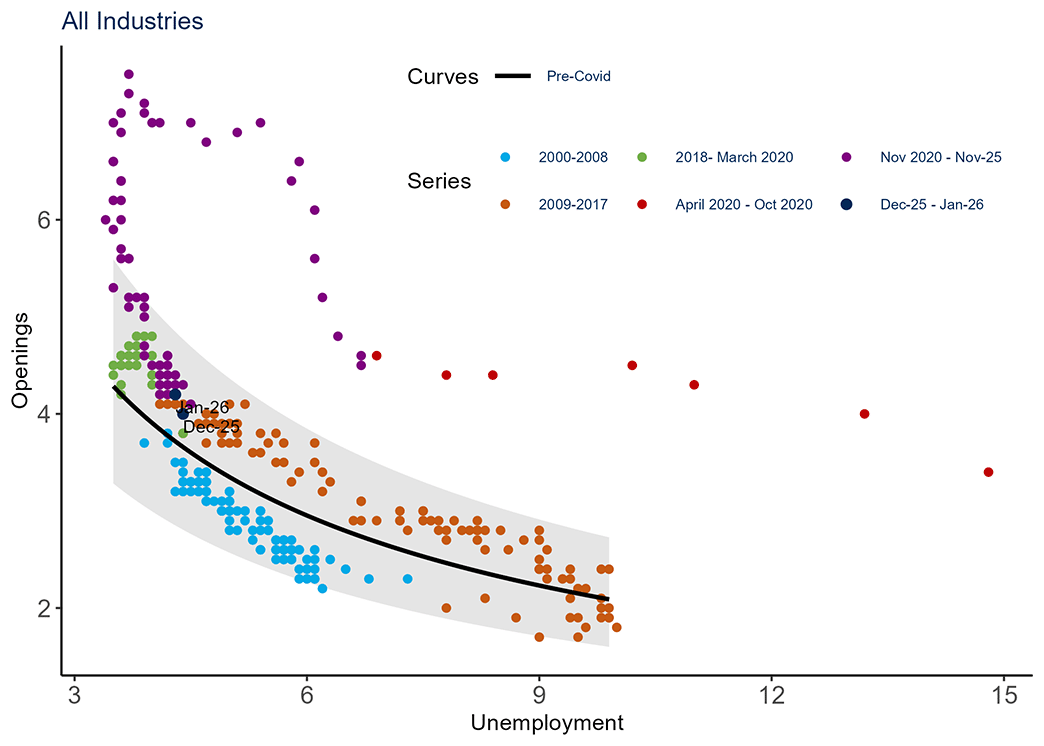
January's JOLTS report may suggest another reason for caution in assessing today's labor market situation. In particular, a statistical regularity known as the Beveridge curve — which is the inverse relationship between the job openings rate and the unemployment rate — suggests that the current trend of declining job openings may soon begin to weigh on the unemployment rate, if prepandemic patterns are a good guide to the future.
Figure 3 below shows the prepandemic Beveridge curve and associated 95 percent prediction interval, estimated on 2000-2020 data. The latest observations indicate that recent monthly readings of the job openings rate and unemployment rate have been consistent with their prepandemic Beveridge curve relationship. January's job openings rate of 4.2 percent represents a continued declining trend from 4.5 percent in January 2025, 5.1 percent in January 2024, and 6.2 percent in January 2023. The Beveridge curve relationship suggests that if the job openings rate continues its deteriorating trend, the unemployment rate could be set to increase.
Views expressed in this article are those of the author and not necessarily those of the Federal Reserve Bank of Richmond or the Federal Reserve System.
Contact Us