

How Prevalent Is Holding Multiple Jobs in the Postpandemic Labor Market?
Economic Brief
September 2026, No. 26-29
Key Takeaways
- The share of employed Americans who hold more than one job has climbed each year since its April 2020 low, peaking at 6.0 percent at the end of 2025 before easing to 5.5 percent by July 2026.
- The share of middle-income families and college-educated workers has increased among those with multiple jobs. While additional jobs contribute meaningfully to the worker’s earnings, the increase in earnings does not translate to growth in aggregate consumption.
- Official statistics almost certainly understate how many people work multiple jobs, particularly in informal and platform-based arrangements.
Working multiple jobs has drawn renewed attention as the labor market has tightened. Taking on a second job can signal financial strain, opportunity or both. This article uses microdata from the Current Population Survey (CPS) to document how multiple jobholding has evolved since the COVID-19 pandemic, who accounts for the recent increase and how much the additional income has contributed to the recovery in consumer spending.1
A Recovery, Not a New High
The share of employed people holding more than one job fell sharply during the pandemic — reaching 4.1 percent in April 2020 — but has risen in each subsequent year. At 5.5 percent in July 2026, the rate is at roughly where it stood at the turn of the century (as seen in Figure 1), though it remains below the range of 6 percent to 7 percent that prevailed in the mid-1990s.
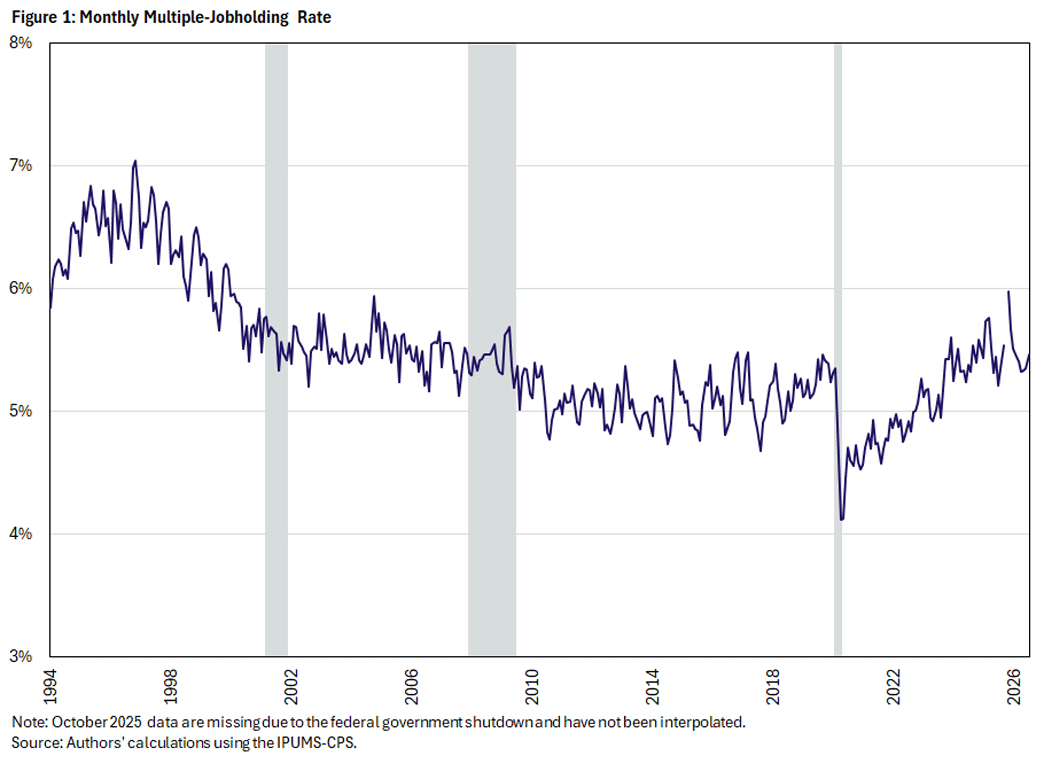
The recovery is best characterized as a rebound: The multiple-jobholding rate has fluctuated between about 5 percent and 6 percent for much of the past 25 years, and the most recent readings sit within that band. Between January and July 2026, the rate fell from 6.0 percent to 5.5 percent. While that decline is notable, it is not outside the range of ordinary month-to-month volatility in the data series.
The Increase Is Concentrated Among Middle-Income Families
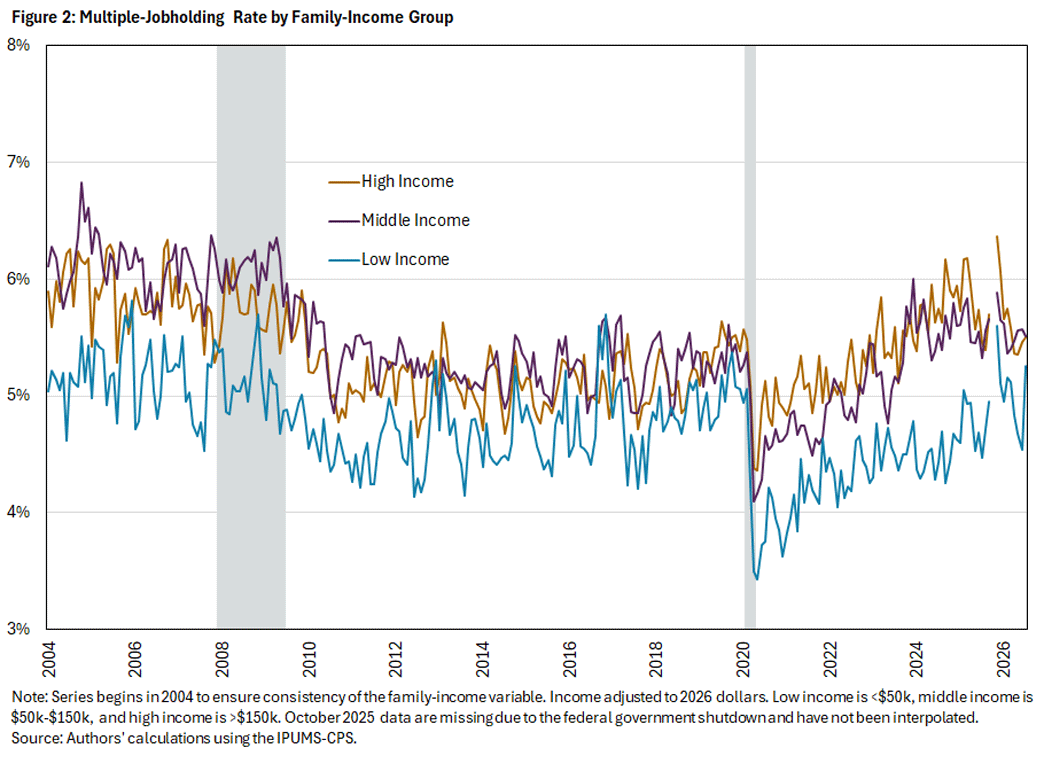
Underlying the aggregate rate are meaningful differences across the income distribution. In 2021, multiple-jobholding rates were similar across income groups (with figures expressed in 2026 dollars):
- 4.2 percent for families earning less than $50,000
- 4.7 percent for those earning between $50,000 and $150,000
- 5.1 percent for those earning $150,000 or more
By 2025, the rate for the middle-income group had pulled well above the lowest and close to the highest, reaching 5.6 percent versus 5.8 percent for the top band and 4.9 percent for the bottom, as seen in Figure 2. In either absolute (0.9 percentage points) or relative (roughly 19 percent) terms, the middle-income group recorded the largest increase between 2021 and 2025.
Over a longer horizon, college-educated workers have become an increasing share of multiple jobholders: The share of multiple jobholders who hold a college degree has risen from about 35 percent in the 1990s to roughly 50 percent in 2024.2
Multiple-Jobholding Rates Vary Widely by Type of Employer
Multiple-jobholding rates also differ sharply according to the type of employer at a worker's primary job. In the early 2000s, rates were highest among local and state government workers (9.4 percent and 8.1 percent, respectively) and in the private nonprofit sector (8.2 percent). Multiple-jobholding rates among the incorporated self-employed sat in the bottom half of the distribution.
Two decades later, the ranking has been reshuffled. Rates have declined for workers across nearly every employer type, but the rate for the incorporated self-employed rose by 2.3 percentage points. Now at 8.0 percent, this group has the highest rate of any group, as seen in Table 1.
The multiple-jobholding rate in the for-profit sector is comparatively low at 4.6 percent, but because for-profit firms employ the large majority of workers, this group carries substantial weight in the overall average and pulls it down. As a result, the economy-wide rate is considerably lower than the rate in several individual sectors.
| Class of Employer (Primary Job) | 2000-02 | 2023-25 | Change (pp) |
|---|---|---|---|
| Self-employed, incorporated | 5.64% | 7.98% | +2.34 |
| Private, nonprofit | 8.18% | 7.95% | -0.23 |
| Local government | 9.35% | 7.62% | -1.72 |
| State government | 8.10% | 7.39% | -0.72 |
| Self-employed, unincorporated | 6.40% | 6.30% | -0.10 |
| Federal government | 5.59% | 5.29% | -0.29 |
| Private, for-profit | 4.79% | 4.55% | -0.24 |
| Unpaid family worker | 4.55% | 2.86% | -1.69 |
| All employed | 5.62% | 5.37% | -0.25 |
| Notes: Rows are ordered by the 2023-25 rate. Type of employer is obtained from IPUMS-CPS. The armed forces are excluded. Source: Authors' calculations using the IPUMS-CPS. |
|||
Second Jobs Are a Meaningful Share of Earnings
How much do second jobs contribute to the earnings of those who hold them? Using the U.S. Census Bureau's Longitudinal Employer-Household Dynamics (LEHD) data (which link workers to employers through administrative records), a 2021 paper by Keith Bailey and James Spletzer finds that a secondary job accounts for about 28 percent of a multiple jobholder's total quarterly earnings.3 It also documents that multiple jobholders tend to earn more at their primary jobs than comparable single jobholders. This suggests that a second job often reflects capacity and opportunity rather than an inability to secure adequate hours at a single employer. In other words, the additional job is far from marginal for the workers involved.
Multiple Jobholding Is Not a Major Driver of Consumption Growth
That a second job matters to individual workers does not mean multiple jobholding matters much for the macroeconomy. Because the recovery in the multiple-jobholding rate coincided with a strong rebound in consumer spending, it is natural to ask whether income from second jobs has driven that spending. However, a simple back-of-the-envelope calculation suggests that it has not.4
Applying the overall multiple-jobholding rate to total employment in each period yields about 5.5 million multiple jobholders in April 2020 and 8.7 million in July 2026 — an increase of roughly 3.2 million. If each additional second job generates about $19,900 (in 2026 dollars) and if all of that income is spent (rather than saved), the added spending amounts to about $64 billion. Set against the roughly $9.4 trillion increase in aggregate personal consumption expenditures over the same period, that added spending would account for only about 0.68 percent of consumption growth. This likely even overstates the contributions of income from second jobs, as we generously assume that all earnings from the second job are spent.
| Component | Value | |
|---|---|---|
| A | MJH rate, April 2020 | 4.10% |
| B | MJH rate, July 2026 | 5.47% |
| C | Employment, April 2020 | 133,326,000 |
| D | Employment, July 2026 | 158,858,000 |
| E | Multiple jobholders, April 2020 (A x C) | 5,466,366 |
| F | Multiple jobholders, July 2026 (B x D) | 8,689,533 |
| G | Growth in multiple jobholders (F - E) | 3,223,167 |
| H | Annual second-job earnings (2026 $) | $19,867 |
| I | MJH contribution to consumption growth (G x H) | $64,034,658,789 |
| J | Growth in aggregate consumption (PCE) | $9,430,800,000,000 |
| K | MJH contribution to consumption growth (I/J) | 0.68% |
| Sources: Authors' calculations using nonfarm payroll employment (accessed via FRED), the CPS (accessed via IPUMS) and data from the 2021 paper "A New Measure of Multiple Jobholding in the U.S. Economy." | ||
Even if the true multiple-jobholding rate were as high as 10 percent — well above the official figure — the implied contribution would still be only about 2.2 percent of consumption growth if all the additional income was spent. Multiple jobholding, in short, is not a major engine of aggregate consumption growth.
Official Statistics Likely Understate Multiple Jobholding
These conclusions come with an important caveat: The official statistics almost certainly understate the true extent of multiple jobholding. Bailey and Spletzer's paper shows that the CPS measure is lower than the rate implied by administrative records and that the gap has widened over time. In 2018, the last year of their analysis, their administrative estimate of the multiple-jobholding rate was nearly 8 percent — about 3 percentage points higher than the contemporaneous CPS figure.5
Part of the gap reflects what the CPS measure is designed to capture. As noted in a 2023 working paper, the CPS measure counts formal second jobs but undercounts informal, contingent, gig and platform-mediated work.6 Such work is difficult to measure precisely because it takes place outside a conventional employment relationship: It is often performed on an ad hoc basis (such as for friends or family), and it is not always regarded as a "job" by survey respondents or the proxies who answer on their behalf.
Platform-mediated work — such as driving for a ride-hailing service or delivering for a food-delivery app — is especially likely to be missed. Such activity is generally classified as self-employment, and the CPS multiple-jobholding measure requires that at least one of a worker's jobs be wage-and-salary employment.7 A worker whose jobs are all unincorporated self-employment and doesn't have a wage-and-salary job would therefore not be counted as a multiple jobholder at all. Comparisons with tax records confirm the undercount.8
Administrative records tell a similar story. Comparing household surveys with tax and other administrative data, a trio of works by Katharine Abraham, John Haltiwanger, Kristin Sandusky and James Spletzer finds that a large and growing share of workers with self-employment activity in administrative records report none of it in household surveys.9 The gap is widest where gig work has grown fastest: Nonemployer activity in ground-passenger transportation — the industry that includes ride-hailing — expanded by nearly 300 percent between 2010 and 2016, a surge almost entirely absent from the CPS.
Several surveys attempt to measure these alternative arrangements more directly, including the CPS's Contingent Worker Supplement, the Boston Fed's Survey of Informal Work Participation and the Census Bureau's Survey of Income and Program Participation. Each one offers a fuller picture of informal and contingent work, but none are available at a monthly frequency or through the present, so none can be used to track these arrangements in real time.
Conclusion
Multiple jobholding has recovered steadily from its pandemic low, returning to the range that has prevailed for most of the past quarter-century. The recent increase has been concentrated among middle-income families and, over a longer horizon, among college-educated workers. Also, multiple-jobholding rates differ meaningfully by type of employer. For the workers who hold them, second jobs provide a meaningful share of earnings. For the macroeconomy, however, multiple jobholding has been a minor contributor to the postpandemic recovery in consumer spending.
Perhaps the most important qualification is measurement: Because official statistics miss much informal and platform-based work, the figures reported here are best treated as a floor. As alternative work arrangements continue to evolve, closing that measurement gap will be essential to understanding how Americans piece together a living and how much that work contributes to the broader economy.
Kyle DeMaria is a regional economist and advisor for workforce pathways, and Urvi Neelakantan is a senior policy economist, both in the Research Department at the Federal Reserve Bank of Richmond.
1
Specifically, data are from the IPUMS-CPS, January 1994-July 2026. Rates are not seasonally adjusted.
2
See the 2023 article "Overemployed Workers? Trends on Multiple Jobholders" by Serdar Birinci and Carlos Garriga.
3
See the 2021 paper "A New Measure of Multiple Jobholding in the U.S. Economy" by Keith Bailey and James Spletzer.
4
For this calculation, we drew employment and personal consumption expenditures from FRED. The assumed second-job earnings figure follows the previously cited paper "A New Measure of Multiple Jobholding in the U.S. Economy," and the remaining calculations are our own.
5
See the previously cited paper "A New Measure of Multiple Jobholding in the U.S. Economy."
6
See the 2023 working paper "Informal Work and Official Employment Statistics: What's Missing?" by Anat Bracha and Mary Burke.
7
On the classification of platform work as self-employment, see the Bureau of Labor Statistics page "FAQs About Data on Electronically Mediated Employment (CPS)."
8
See the 2019 paper "The Rise and Nature of Alternative Work Arrangements in the United States, 1995-2015" by Lawrence Katz and Alan Krueger and the 2021 paper "How Big Is the Gig? The Extensive Margin, the Intensive Margin and the Hidden Margin" by Anat Bracha and Mary Burke.
9
See the 2019 paper "The Rise of the Gig Economy: Fact or Fiction?," the 2021 paper "Reconciling Survey and Administrative Measures of Self-Employment" and the 2021 book chapter "Measuring the Gig Economy: Current Knowledge and Open Issues," all by Abraham, Haltiwanger, Sandusky and Spletzer.
To cite this Economic Brief, please use the following format: DeMaria, Kyle; and Neelakantan, Urvi. (September 2026) "How Prevalent Is Holding Multiple Jobs in the Postpandemic Labor Market?" Federal Reserve Bank of Richmond Economic Brief, No. 26-29.
This article may be photocopied or reprinted in its entirety. Please credit the authors, source, and the Federal Reserve Bank of Richmond and include the italicized statement below.
Views expressed in this article are those of the authors and not necessarily those of the Federal Reserve Bank of Richmond or the Federal Reserve System.


Subscribe to Economic Brief
Receive a notification when Economic Brief is posted online.
Contact Us