

Understanding the Debate on the US-Europe Paradox
Economic Brief
September 2026, No. 26-30
Key Takeaways
- European countries' gross domestic products (GDPs) relative to the U.S. at current purchasing power parity (PPP) have stayed fairly constant since 2001. However, U.S. real GDP at national constant prices has grown much faster than its European counterparts. This apparent paradox can be explained by the U.S. IT boom.
- While these facts are not being disputed, there is a debate between economists on what this implies for European welfare. From these facts alone, it is not straightforward to conclude whether Europe is in decline or not.
- Statements on Europe's welfare will strongly depend on the assumptions one is willing to make on how the gains of the U.S. IT boom are dispersed across countries.
A recurring claim in economic commentary is that Europe is in relative decline against the U.S. In fact, the European Union (EU) commissioned a report from former European Central Bank (ECB) President Mario Draghi to investigate how to "restore Europe's dynamism and boost [its] economic growth." In a recent commentary, however, economist Paul Krugman argued that Europe might not be falling behind the U.S. economy after all, saying to Europeans that "you're much stronger than you seem to believe."
Despite this optimistic conclusion, his article drew criticism from a group of European economists (namely, Philippe Aghion, Antonin Bergeaud and Luis Garicano) who argued the opposite:1 Europe is lagging the U.S., and this disparity is becoming larger over time.
The striking thing about their disagreement is that, on the underlying numbers, the two camps barely (or do not at all) disagree. The disagreement lies in the implications of their findings and how to interpret the question "Is Europe falling behind?" In this article, I retrace the arguments from both groups and examine how robust is Krugman's seemingly reassuring conclusion that Europe's not falling behind.
Is Europe in Economic Decline? The "No" Viewpoint
Krugman's starting point is an apparent contradiction. On conventional measures, growth in real gross domestic product (GDP) per capita has favored the U.S. since around 2000: The American economy has consistently posted faster measured real growth than France, Germany or Italy. And yet, when comparing European living standards to American ones as levels — converting each country's output into a common currency using purchasing power parity (PPP) and tracking the ratio over time — European economies have not slipped (much). For example, the ratio of French-to-American GDP per capita at PPP has been roughly flat for two decades.
Krugman calls this the U.S.-Europe paradox. U.S. economic growth is much higher than Europe, yet European living standards (relative to the U.S.) have stayed constant. Krugman emphasizes that these are two different measurements. One is the growth rate of each country's own real GDP, computed at its own constant prices. The other is the relative level of the two economies, valued at a common set of prices at each point in time. While the first favors the U.S., the second does not. His conclusion is that the widespread "Europe is collapsing" narrative reads far too much into the growth-rate gap, because the most vital object of interest — how rich Europeans are relative to Americans — has held steady.
It is worth being precise about the measure he leans on. Krugman's flat line is based on converting European output to dollars using current-year prices. Hence, it is a comparison across space at a single moment but repeated for each year.
Is Europe in Economic Decline? The "Yes" Viewpoint
In reaction to Krugman's article, Aghion, Bergeaud and Garicano (henceforth, ABG) argue that Europe actually has fallen behind. An important thing to note is that ABG do not disagree with Krugman on his empirical finding. The ratio of European-to-U.S. GDP has stayed constant at current prices. However, they argue this is not a correct measure to trace a country's performance over time. To measure real productivity growth, each country's GDP should be converted to constant dollars (from some base year) using a national deflator. Their reasoning is simple: Economic growth should capture the growth in nominal GDP that is due to an increase in output/quality, not due to prices (that is, not due to inflation). The main problem with Krugman's methodology is that converting European output to current dollars does not distinguish changes in quantities from changes in prices.
This difference in dealing with the data is the heart of the whole debate. A current price PPP is a price comparison made at one date. It never performs the quality adjustment over time that a national price deflator performs every year. If a country doubles its output while the international price of goods halves, a current-PPP comparison records no increase in value at all: The doubled quantity is exactly cancelled by the halved price. A national accounts deflator, by contrast, credits that volume expansion as real growth, because its quality-adjusted price index for those goods falls fast, and dividing nominal output by a fast-falling price index yields a large real quantity.
Importantly, ABG show that the difference in using current PPP or national deflators carries no information about how much more was actually produced. Instead, it is pure price movement. They conclude that Europe's productivity growth has clearly lagged America's and that this lag is real, not an "accounting" artifact. Importantly, this lag in productivity growth has real, long-run consequences for European countries' welfare. While ABG are not very precise on this issue in their article, they do argue that Europe has a serious problem. U.S. wages and profits are increasing, and the gap between the U.S. and Europe is widening.
The Mechanics Behind the Differing Numbers: Current PPP and National Deflators
The entire dispute seems to rest on whether Europe's relative GDP figures should be evaluated at current (PPP from Krugman) or constant (national GDP deflator from ABG) prices. In the following, I will dive deeper into the mechanics behind these price indexes.
PPP is a currency conversion factor built from prices rather than from financial markets, and it answers a single question: How many euros buy the same real basket of goods and services as one dollar right now? It exists because market exchange rates are a poor guide to relative living standards: They are driven by capital flows and traded goods, and they systematically understate the real incomes of poorer countries where nontraded services like housing, haircuts and health care are cheap. PPPs are constructed by international price surveys — such as the International Comparison Program and the annual Eurostat-OECD program — which collect prices for a long, matched list of specified goods and services, group them into a few hundred "basic" consumption groups and weight them by each country's expenditure shares.
The defining feature is that PPP compares different places at a single moment, using that moment's prices. Current PPP simply means using each year's freshly estimated PPP, so that both economies are annually reconverted into common "international dollars" at that year's price level. A current-PPP comparison of two countries in a given year is therefore just the ratio of their nominal outputs, each divided by that year's PPP. Krugman's exercise computes that ratio year after year, and he observes that it does not display a trend for the largest European countries.
A national GDP deflator produces a different effect. It is a price index for everything a single country produces, and it measures how those prices move over time. Real GDP is nominal GDP divided by the deflator — or, equivalently, real GDP is built by deflating each component of output by its own price index and adding them up. So, a deflator compares the same place at different dates in a single currency. Modern national accounts construct these deflators by chain-linking adjacent years and, crucially, by adjusting for quality change: When this year's laptop is faster and pricier than last year's, statisticians use hedonic statistical methods to split the price increase into a part that is genuine inflation and a part that is simply "more quantity or quality." The latter part is recorded as real output growth. This is the channel through which technological progress enters real GDP, and it operates most powerfully exactly where products improve fastest. The growth rate of real GDP at constant national prices is the measure ABG insist on.
The asymmetry between the two objects is the crux of everything that follows. Because it compares two places at the same date, PPP never has to ask whether this year's laptop is better than last year's. Instead, it only asks whether the American and the European laptops are comparable today. A deflator, on the other hand, asks precisely that over-time question because it compares one place across dates and answers it through quality adjustment. As a result, a chain of annual PPPs performs no over-time quality adjustment, while a deflator performs it every single year.
There is no economic theorem that forces the two to agree. When they disagree, the difference is pure price movement — the "price residual" — and it can be large in sectors (such as IT) where quality and prices move fastest. Krugman's stable line is built from the first object, ABG's growth gap is built from the second, and the rest of the debate is about what to make of the wedge between them.
Talking About Different Things
The debate becomes much less mysterious after noticing that the two sides are answering different questions with different — and individually correct — methods. To see it in real data, the comparison can be reconstructed directly from the Penn World Tables (PWT), measuring GDP per capita for Germany, France, Italy and the U.S. for the period 2001-23.
Figure 1a shows Krugman's object: the relative level — each European economy's GDP per capita as a percentage of the American level — converted at current PPP.
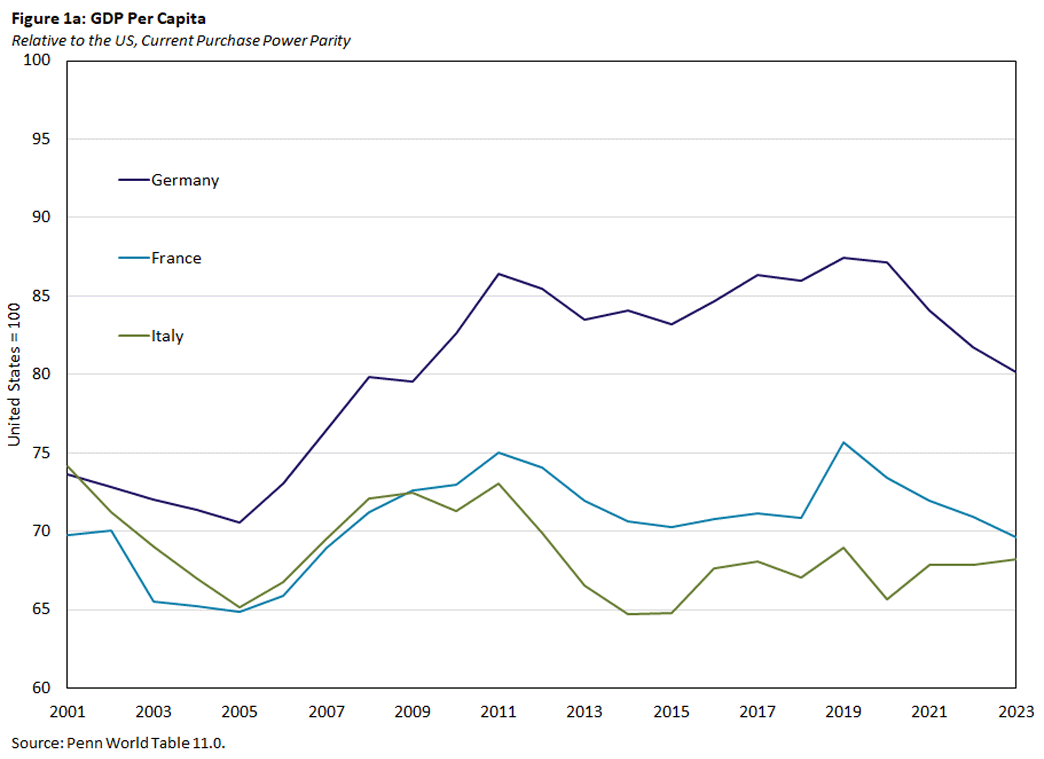
The relative positions are broadly stable — which is precisely Krugman's point — though they are not identical across countries:
- Germany's standing compared to the U.S. actually rises over this period from about 74 to 80 percent of the U.S. level.
- France is essentially flat at around 70 percent.
- Italy clearly declines, from about 74 to 68 percent.
Thus, the "no decline" reading holds well for Germany and France but is less robust for Italy.
According to the PWT, chained PPP is the proper measure for comparisons across countries and over time. However, switching from current to chained PPP barely changes the story, as seen in Figure 1b.
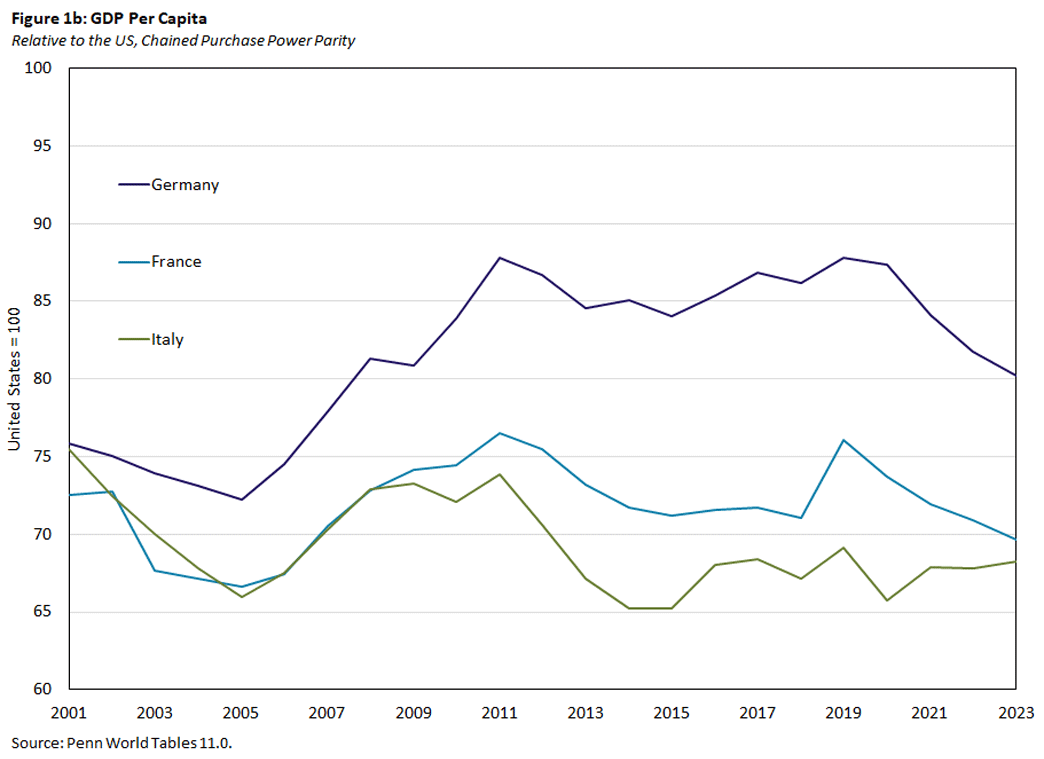
Figures 1a and 1b are almost indistinguishable: Germany ends at 80.1 percent under current PPP and 80.2 percent under chained PPP, and France ends at 69.6 percent and 69.7 percent. A similar conclusion can be drawn for Italy. This is partly mechanical: The PWT anchors on the 2021 international price benchmark, which sits inside the 2001-23 window, so the two PPP variants nearly coincide.
The lesson is that the choice between current and chained PPP — which much of the technical discussion obsesses over — is a minor issue. As ABG argue, the key is to measure relative European GDPs through constant national prices, which are shown in Figure 2.
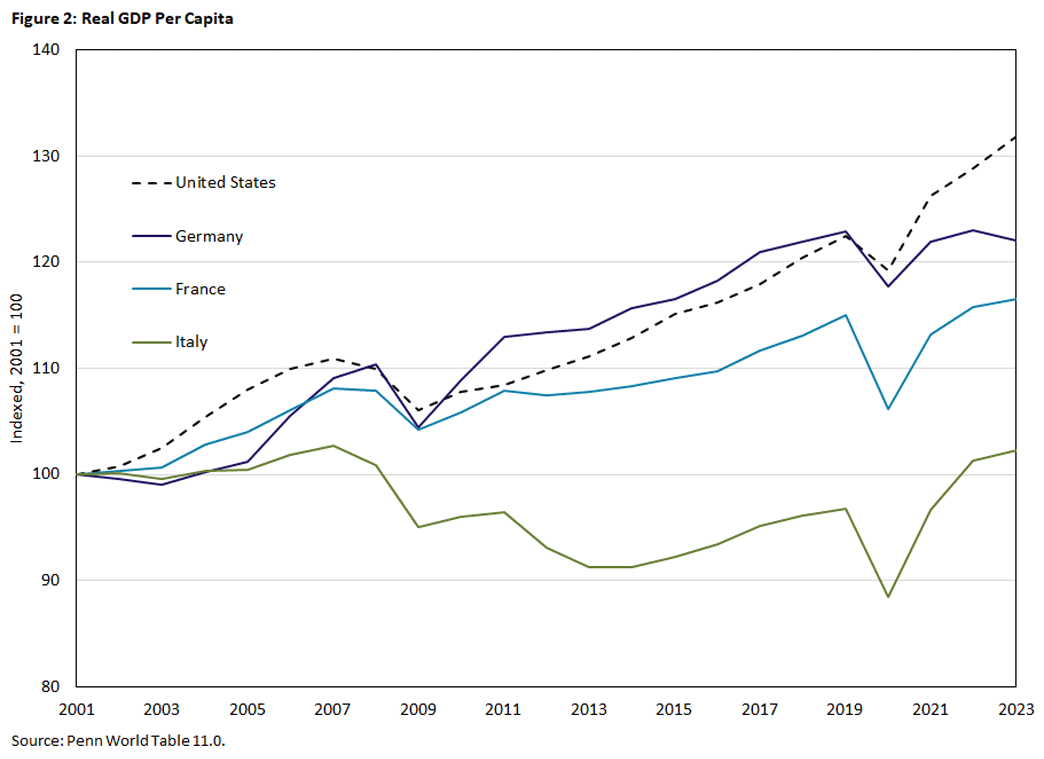
Here, the line for the U.S. pulls clearly and steadily away: By 2023, the U.S. reaches about 132, compared to 122 for Germany, 117 for France and just 102 for Italy (which translates to 22 years of essentially zero growth in Italian real GDP per capita). This is ABG's gap, and it is not in dispute.
One caveat about the denominator is that these figures are GDP per capita. On a per-hour (productivity) basis, the European economies sit far closer to the U.S. — roughly 90 to 100 percent rather than 70 to 80 — because Europeans work substantially fewer hours per worker. Per capita is therefore less favorable to Krugman's argument, since it folds in Europe's lower labor utilization on top of any productivity difference. Thus, the stability of the relative line is even more pronounced on a per-hour basis.
So, both authors make a point. Relative levels at PPP have stayed roughly constant for Germany and France — though not for Italy — while growth rates measured at constant national prices have favored the U.S. across the board. The reconciliation between the two is the price residual, and its economic content appears to be a single sector. The next section traces how the rise of American IT produces both halves of the paradox at once.
The US IT Boom
The remarkable thing is that a single underlying force — rapid productivity growth in American IT, which is usually accompanied by collapsing IT prices — can generate both of the seemingly contradictory facts at once. It is worth tracing the mechanism slowly, because that is what makes the paradox dissolve.
IT is the sector where measured productivity grows fastest, where quality-adjusted prices fall fastest and where the U.S. has a disproportionately large share of world production.
Now look through ABG's national deflator lens. The U.S. produces an enormous and growing volume of computing power. Its national accounts deflate that nominal output by a hedonic IT price index that is falling rapidly, and dividing a large nominal flow by a fast-falling price index yields a very large real quantity. The IT boom therefore registers as substantial real growth in American GDP, while Europe gets relatively little of this boost, as it produces far less IT.
The result is precisely ABG's finding: At constant national prices, American productivity races ahead of European. Concretely, suppose the U.S. doubles its real output of computer chips while the price halves. When crediting the volume, the national accounts record real growth of roughly 100 percent in that line, while Europe (which barely produces chips) records nothing.
Now look at the very same economies and situation through Krugman's current PPP lens. A current PPP comparison values each year's output at that year's international prices. By the later years, chips are cheap everywhere, because the world price has collapsed along with the cost of the technology. So, when you value the American chip boom at today's low prices, it adds almost nothing to America's measured size relative to Europe.
Take the same (extreme) example: The U.S. doubled its chip output, but the price halved, so the current value of that output is unchanged, as twice the quantity at half the price is the same number of dollars. Therefore, a comparison made at current prices sees no American advantage emerging from chips at all. The result is exactly Krugman's flat line: Repriced each year at the cheaper IT prices, the U.S. does not pull ahead.
Thus, the two facts are not in tension, but they are simply two readings of one event. The same price collapse that the national deflator credits to the U.S. as real growth is the thing that, in the current PPP comparison, cancels the U.S.'s volume advantage. Fast growth at constant national prices and flat relative levels at current PPP are simply the front and back of the falling price of IT.
This is also why the price residual that ABG isolate comes out roughly equal to the entire measured growth gap: The residual is the accumulated decline in the relative price of U.S. goods, and that decline happens to be large enough to absorb almost all of America's extra real growth. It is no coincidence that their France-U.S. residual, at around 18 log points, is about the size of the productivity-growth gap it has to explain.
One feature of this story already foreshadows the welfare argument to come. Europe produces little IT but consumes plenty of it, and it buys that IT at the same falling world prices Americans do. So even as Europe's measured productivity growth lags, European consumers enjoy the same cheaper computing power.
Whether that makes the growth gap harmless is exactly the question. Krugman argues that while Europe grows less than the U.S., it is not worse off because it benefits from the U.S. IT boom. Europe's welfare stays roughly constant, which is what matters the most according to Krugman. While this argument sounds intuitive, it is hard to dissect the necessary assumptions that keep it standing. To understand Krugman's argument, I will briefly focus on a simple model he described in one of his recent articles.
Krugman's "Very Wonkish" Model
Krugman's most provocative move is to argue that the growth gap (even granting it is real) need not imply that Europeans are worse off. He makes the case with a simple model that he describes as "very wonkish."
Imagine two places with equal labor forces and two goods: tech and nontech. Consumers everywhere spend a constant share α of income on tech. Nontech is produced in both countries with identical constant labor productivity, and it is tradable, which equalizes wages across the two countries and therefore equalizes current price GDP. Tech is produced only in the U.S., where its productivity grows at rate ρ.
Krugman's model delivers three results:
- American real GDP — measured the way national accounts measure it — grows at 2αρ, while Europe's grows at zero.
- Relative GDP at current prices nonetheless stays fixed at 1.
- Real wages — which is the correct measure of welfare in this model — rise at αρ in both countries.
Thus, measured output diverges, while living standards do not.
The intuition is that the U.S. produces the good with a falling price, but because that good is tradable and consumed by everyone at the same world price, the productivity gains are passed straight to consumers everywhere through lower prices. The American economy, as the producer, effectively gives the gains away through deteriorating terms of trade: Its real output grows faster than its real income. Europe, importing the ever-cheaper tech, enjoys a terms-of-trade gain that lifts its real income above its flat real output. The two effects meet in the middle, and both populations see their living standards rise at the same rate. On this reading, the growth gap is largely a price artifact, and the alarm about European decline is misplaced.
But this conclusion is only as strong as its assumptions, and the assumptions are doing a fair amount of work. The model has labor as the only factor, so there are no rents for the producing country's owners to capture. It has full pass-through of productivity gains into lower tradable prices, so the producer keeps none of them. It also has identical preferences, so both countries enjoy the cheaper tech in equal measure. Above all, it quietly equates welfare with current consumption valued at common prices: The model is constructed so that the constancy of the current price GDP ratio coincides with the equality of living standards between the U.S. and Europe. Under this setup, welfare grows at αρ. The benign result is built into the setup rather than discovered in it.
The cleanest way to see what is load bearing is to separate production from consumption. The U.S. producing the deflating good is what generates the growth gap. Everyone consuming it at common prices is what delivers the shared welfare. Krugman's "reassuring" conclusion on welfare needs the second condition every bit as much as the first.
Assessing the Robustness of Krugman's Framework
How robust is the conclusion that, despite a difference in economic growth, welfare across the two places is equalized? The answer is not very, unfortunately. A useful organizing principle helps here. With identical preferences, common prices and GDP equal to national income, the welfare ratio between two places is forced to equal their current price GDP ratio. That is, the cost of living is common and cancels.
To pry the two apart — so that current price GDP stays constant while welfare diverges under differing growth rates across the two places — one must break at least one of those conditions (all three of which are economically realistic):
- Make the consumption baskets differ
- Make the prices differ
- Make national income differ from GDP
The simplest is asymmetric preferences. Suppose Americans spend a larger share of income on tech than Europeans.2 Then the falling price of tech lowers the American cost of living faster, and welfare diverges at the rate equal to the difference between what Americans spend on tech and what Europeans spend on tech, times the U.S. tech productivity growth rate, even though wages and hence current price GDP (that is, labor income) remain equal. The reassuring conclusion was, in part, an artifact of assuming the two populations consume identical baskets.
However, GDP at current prices across the two places was equalized. In the data, the ratio of U.S. GDP to European countries (at current PPP) is quite constant but less than 1. To incorporate this fact (which will be useful for later), let us add profits for U.S. tech. Let U.S. tech run on decreasing returns to scale technology in labor only. Decreasing returns in the only mobile factor imply an implicit fixed factor (think of it as IP) owned by Americans and earning a rent. That rent solves out to a constant, which lifts the current price GDP ratio to a fixed value strictly above 1.
Layer the asymmetric preferences on top, and welfare still diverges at the same point mentioned earlier. Two independent knobs are apparent:
- Profits set the level of the GDP gap.
- The preference asymmetry sets the growth of the welfare gap.3
While the assumption that Americans spend more on tech than Europeans seems plausible, there is another way to break Krugman's result with symmetric preferences. As ABG mention: "The U.S. lead in technology and innovation is not helping America and Europe in the same way. It has led to higher U.S. wages and profits, and the gap is widening each year."
To capture this idea in a simple way, we assume common preferences and common prices but break the "GDP = (labor) income" identity. Suppose tech is produced symmetrically in both countries, so that GDP measured by production location stays balanced and its ratio is constant, but the fixed factor — the IP — is owned entirely by U.S. residents, so that all the rents are repatriated. Then, gross national income (GNI), not GDP, is what diverges: The U.S. collects the rents generated on both continents.
To make those rents grow over time rather than sit as a constant level gap, replace preferences with a structure in which expenditure shares increase as prices fall when tech and nontech goods are substitutes. As tech cheapens, the expenditure share on it rises, profits swell, and American national income — and therefore welfare — pulls steadily away from Europe, all while location-based GDP holds its constant ratio. The Cobb-Douglas case from Krugman's original setup — which holds expenditure shares constant — is the knife-edge that freezes the rent and gives only a level gap. Gross substitutability is what turns it into a widening one. This is the GDP-versus-GNI channel, and it is a recognizable feature of the American technology multinational: Production and employment spread across the world, with profits booked to American shareholders.
What these variations show is that Krugman's result, rather than being a general truth, is a feature of his specific, strong assumptions: Americans plausibly do consume more tech-intensive bundles, the frontier tech sector plausibly does earn rents that accrue to its owners, and demand for cheapening tech is plausibly elastic. Each of these on its own reintroduces a welfare divergence that the headline current price/GDP comparison cannot see.
Conclusion
The factual disagreement between Krugman and ABG is narrow. Both accept that American productivity grew faster and that European relative levels at current PPP stayed roughly flat. The residual that can reconcile them is the falling price of IT. The real disagreement involves what to measure and what it means. Krugman measures relative living standards at current prices and concludes, defensibly, that Europe has not fallen behind in the sense that matters most to ordinary people. ABG measure productivity growth at national prices and conclude, also defensibly, that Europe has a genuine and worrying technological lag that the current PPP lens conceals.
A simple model makes clear why this is not a contradiction and what is necessary (and sufficient) to resolve the paradox. Under Krugman's assumptions, the IT growth gap is simply a price phenomenon shared worldwide. Relax those assumptions in realistic ways — such as different consumption baskets, rents to American owners or elastic demand for the cheapening good — and the gap starts to show up where it counts: in rents, in national income and in the ownership of the frontier. Whether Europe is "in decline" therefore turns less to "disputes" on the data but more towards a discussion on how welfare is constructed.
Chen Yeh is a senior economist in the Research Department at the Federal Reserve Bank of Richmond.
1
A first criticism is the article "European Stagnation Is Real" by Pieter Garicano and Luis Garicano, and a second criticism is the article "The Mismeasurement of European Productivity" by Aghion, Bergeaud and Luis Garicano.
2
This assumption seems consistent with data from the Organization for Economic Cooperation and Development. As a share of GDP, total information and communication technology investment has been consistently higher for the U.S. when compared to Germany, France and Italy over the period 2001-24.
To cite this Economic Brief, please use the following format: Yeh, Chen. (September 2026) "Understanding the Debate on the US-Europe Paradox." Federal Reserve Bank of Richmond Economic Brief, No. 26-30.
This article may be photocopied or reprinted in its entirety. Please credit the author, source, and the Federal Reserve Bank of Richmond and include the italicized statement below.
Views expressed in this article are those of the author and not necessarily those of the Federal Reserve Bank of Richmond or the Federal Reserve System.
 Download Appendix


Subscribe to Economic Brief
Receive a notification when Economic Brief is posted online.
Contact Us