


The Partisan Conflict Index tracks the degree of political disagreement among U.S. federal lawmakers.
Partisan Conflict Over Trade Policy
Economic Brief
October 2026, No. 26-33
Key Takeaways
- The Trade Partisan Conflict Index (Trade-PCI) measures the intensity of partisan disagreement over trade policy at a monthly frequency (since 1981).
- Partisan conflict over trade reached its highest level on record in 2025, with the surge specific to trade rather than to a broader rise in political polarization.
- The Trade-PCI measures partisan conflict, not the realized effects of tariffs. Announced tariff rates far exceeded the duties actually collected, and their short-run effects on prices and employment were modest. However, disagreement this intense and persistent can weigh on long-horizon decisions, such as foreign direct investment into the U.S.
Trade policy has not always been a major source of partisan conflict in the U.S. For much of the 2000s, trade agreements expanded under relative political consensus, attracting minimal media attention. However, that political calm ended suddenly with the tariff announcements of 2018, and the 2025 tariff episode marked an especially large departure from the historical pattern: Partisan conflict over trade reached its highest level in the four-decade history of the Trade Partisan Conflict Index (Trade-PCI). This article uses the Trade-PCI to put the 2025 episode in historical perspective and compares it with the earlier 2018 tariff episode.
Why Partisan Conflict Over Trade Matters
Partisan conflict over trade policy can affect economic decisions even before a new trade policy takes effect. More specifically, trade policy affects choices that involve large, difficult-to-reverse commitments over long horizons. Firms' decisions are dynamic and need predictability, so a firm deciding where to build a plant, whether to enter a foreign market or whether to sign a multi-year contract with a foreign supplier considers both current tariffs and the likely path of future tariffs. Persistent disagreement among policymakers can make future trade policies hard to forecast.
The Trade-PCI provides a way to measure this dimension of the trade-policy environment separately from the policies that are actually implemented. This distinction is relevant because trade policy may affect the economy through two channels: the actual tariffs and the uncertainty about how tariffs will evolve. The index can be used to study whether that uncertainty affects prices, employment, investment or output beyond tariffs' direct effects.
Some of my previous work provides evidence for the second channel. Foreign direct investment (FDI) is particularly exposed because foreign investors commit capital for long periods through investments that are costly to reverse, such as plants and acquisitions. My 2019 paper "The Politics of FDI Exploration" found that, after controlling for standard determinants of capital flows, increases in the Trade-PCI in a given quarter were followed by lower FDI inflows to the U.S. in the subsequent quarter. More generally, my 2018 paper "Partisan Conflict and Private Investment" showed that partisan conflict is associated with U.S. firms postponing investment.
Taken together, these findings hint at the importance of distinguishing political conflict surrounding trade policy from the policy's implementation. Disagreement can impact economic decisions while tariffs are proposed, debated, negotiated or even reversed, and these impacts can play a significant role in the health of the overall economy.
This article does not estimate these effects directly. Instead, I introduce the Trade-PCI and use its four-decade history to assess the recent rise in trade conflict. In particular, I analyze how the intensity and persistence of the 2025 tariff episode compares to the 2018 episode and to earlier periods of trade-policy conflict.
Trade Conflict Is Episodic
The Trade-PCI measures the intensity of partisan disagreement over trade policy in newspaper coverage by tracking debate over trade agreements and the implementation of tariffs and export subsidies. Unlike measures of trade flows and effective tariff rates — which are generally available with a lag — newspaper coverage responds immediately to policy announcements and political debate. The Trade-PCI therefore provides a timely measure of political conflict over trade policy, including periods when proposed changes have not yet been implemented.
Importantly, the Trade-PCI is a measure of political conflict, not a measure of protectionism: A high reading does not necessarily mean that tariffs are high, and a low reading does not necessarily indicate a liberal trade policy. Instead, the index captures how intensely trade policy is being debated. The data for the Trade-PCI are available monthly from 1981, and the index's evolution is displayed in Figure 1.
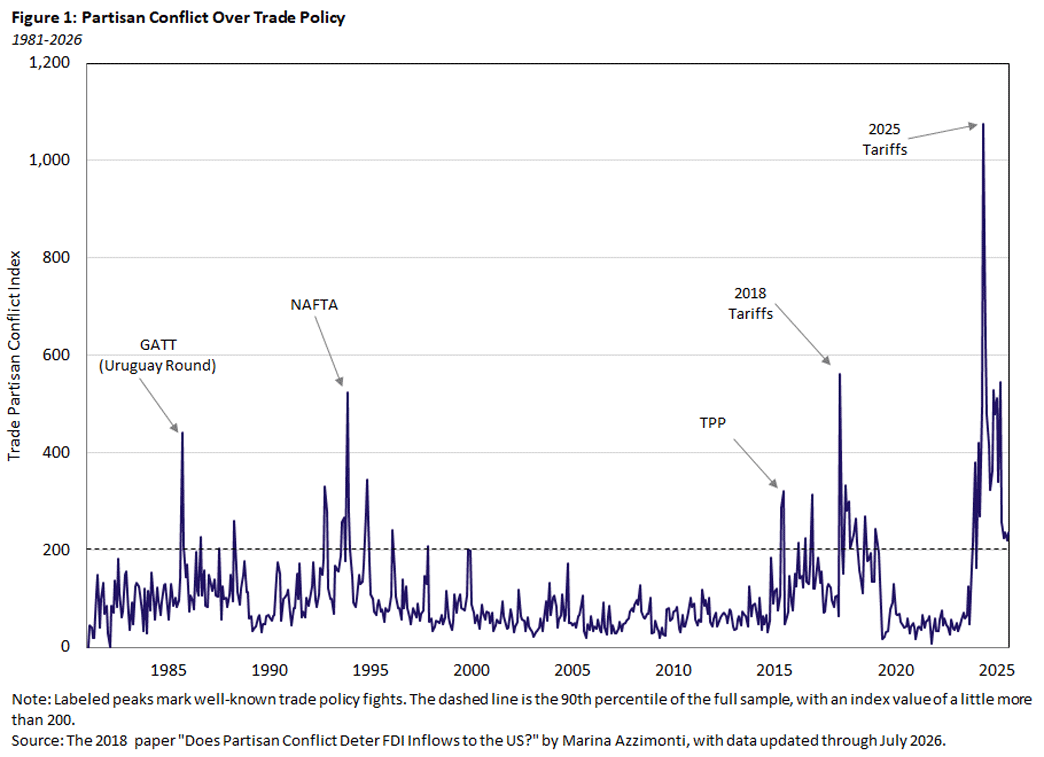
The figure reveals that the Trade-PCI fluctuates substantially over time. Its standard deviation is almost as large as its mean, with a coefficient of variation of 0.91. For long periods of time, trade disagreements among lawmakers received relatively little attention in the media, including much of the 2000s. At other times, it became a major source of partisan conflict, typically surrounding important trade-policy decisions.
The index spiked in 1985 as the U.S. pushed to launch a new round of global trade talks under the General Agreement on Tariffs and Trade (GATT). It spiked again in late 1993 during the congressional battle over the North American Free Trade Agreement (NAFTA). And it rose in 2015 amid the debate over the Trans-Pacific Partnership (TPP) and fast-track negotiating authority. The Trade-PCI reached a new high of 561 in March 2018 as the U.S. imposed tariffs on steel, aluminum and a range of Chinese goods, prompting retaliatory tariffs from trading partners. These episodes reflect political conflict surrounding active policy choices, rather than realized changes in trade flows. The 2025 episode seems like an outlier in the series, with the index reaching unprecedented levels.
An important feature of the Trade-PCI is that its underlying search terms were selected in 2016, well before the large increases in trade-policy conflict observed in recent years. Therefore, the search was not designed around the 2018 or 2025 tariff episodes. This provides some reassurance that the unprecedented readings in 2025 reflect changes in the intensity of trade-policy conflict rather than changes in the definition of what the index is designed to capture.
2025 Was Unusually Intense and Persistent
When trade policy moved back to the center of economic debate in 2025, the scale and persistence of the conflict were both substantially greater than in 2018. This is evident in Figure 2, which covers the Trade-PCI from 2016 to the present. It averaged about 499 in 2025, compared with about 243 in 2018. Also, the 2025 peak was much higher: The Trade-PCI reached 1,076 in April 2025, nearly twice its 2018 peak of 561 and the highest reading in the 45-year history of the series.
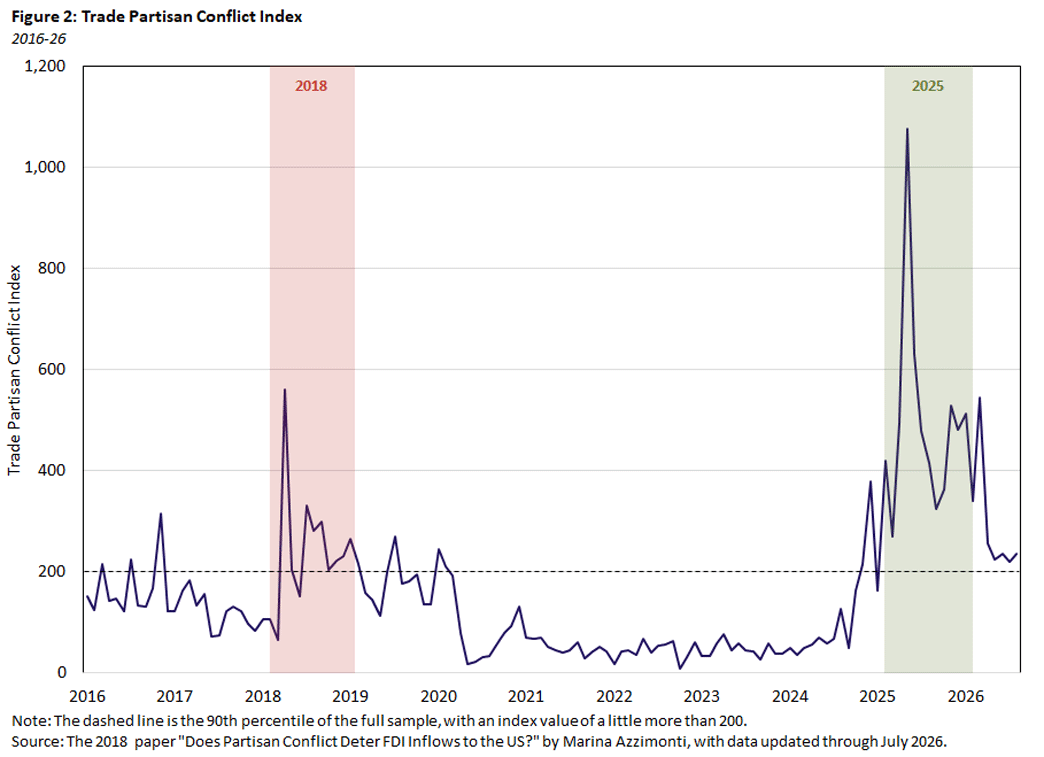
Figure 3 compares the monthly observations in the two episodes. With the exception of March, monthly observations in 2025 were higher than in 2018. For additional perspective, the dotted line represents the 90th percentile of Trade-PCI between 1981 and today. Nine months exceeded this threshold in 2018, whereas all 12 did in 2025.
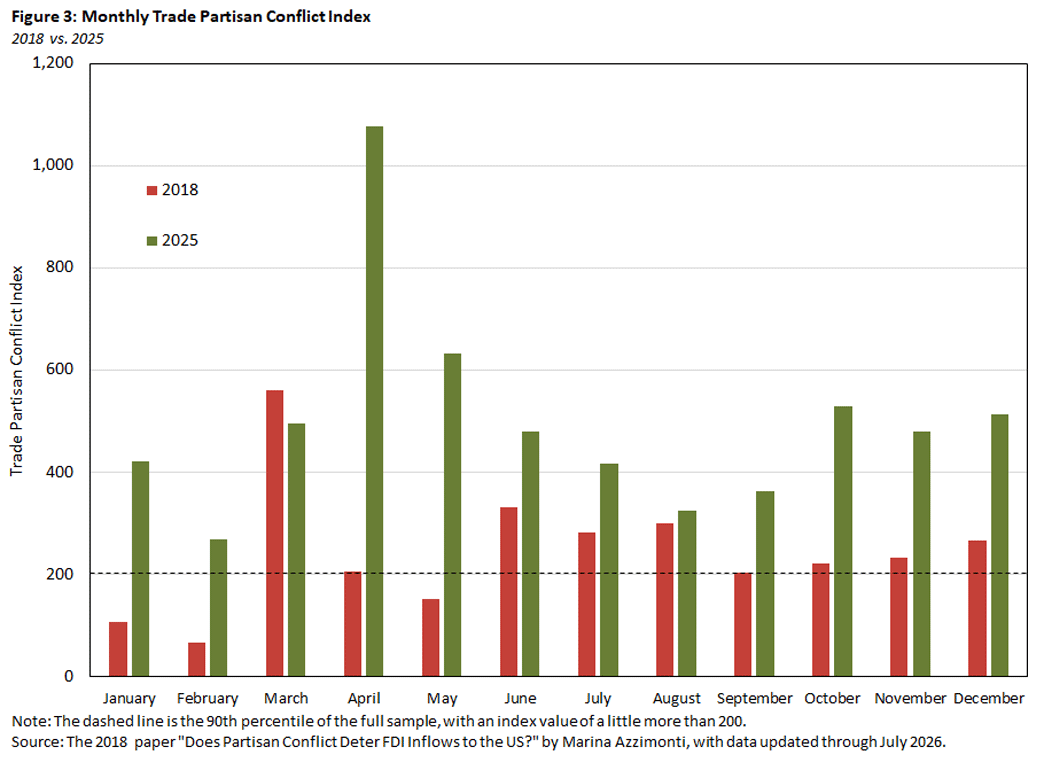
The two episodes also unfolded differently. In 2018, conflict rose sharply with the spring tariff actions and then eased. In 2025, the index rose rapidly and stayed near the top of its historical distribution throughout the year. The 2025 tariff episode was therefore unusual in both intensity and persistence, and persistence matters because businesses may need to make decisions while the direction of trade policy remains uncertain. If policymakers negotiate, revise proposals and signal further action, the policy environment can remain unsettled for months. An announced or effective tariff rate observed at a point in time cannot capture this uncertainty, but the Trade-PCI can.
The Increase Was Concentrated in Trade Policy
Some might argue that the increase in the index simply coincided with more pronounced disagreement between parties about general government policy. Comparing the Trade-PCI with the broader Partisan Conflict Index (PCI) reveals that this is not the case. The PCI also uses newspaper coverage to uncover divisions among lawmakers, but it does not focus exclusively on trade policy.1 Because of this, we can think of the Trade-PCI as a strict subset of the PCI. Hence, if all conflict among policymakers were about trade, the two indexes would coincide. To the extent that other dimensions of conflict become salient, the indexes would show diverging patterns.
Figure 4 displays the PCI and Trade-PCI. While they move together to some extent, their correlation is just 0.39.
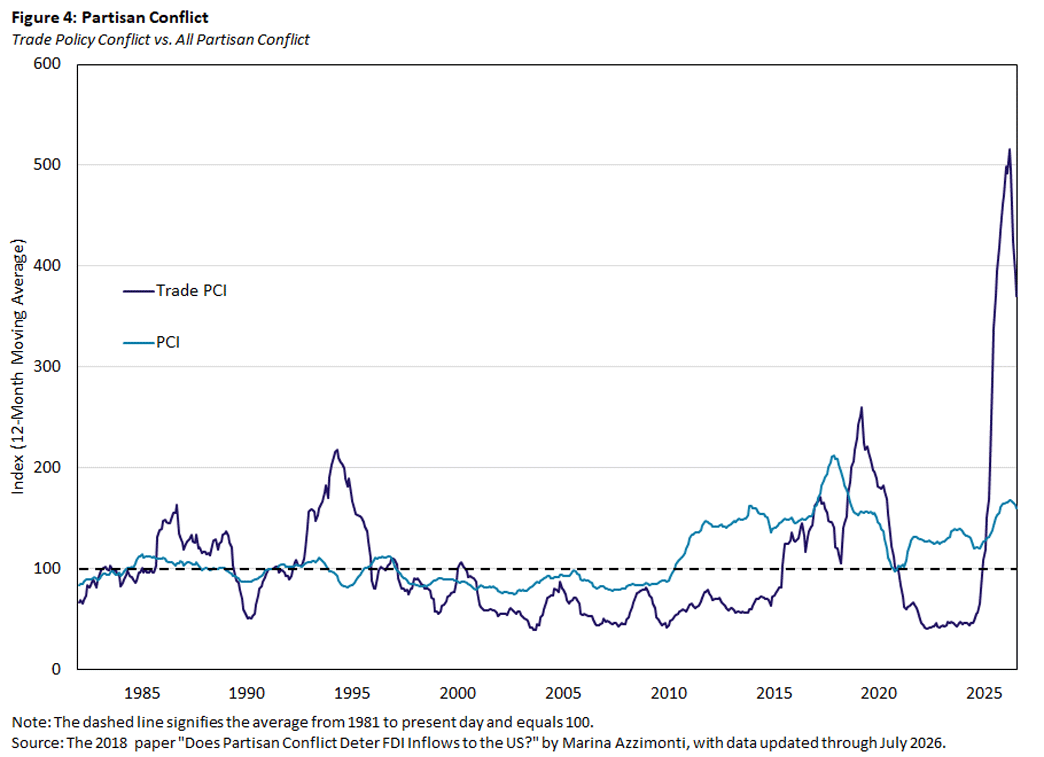
The overall PCI rose following the Great Recession as American politics became more polarized, and it has largely stayed at elevated levels since. The Trade-PCI, on the other hand, has shown periods of relative stability after both the Great Recession and the pandemic. More generally, the PCI is smoother, with a volatility (measured by the coefficient of variation) of 0.30, as seen in Table 1. In contrast, the Trade-PCI is much more volatile (with a coefficient of variation of 0.91). This implies that trade conflict has a cycle of its own.
| Trade PCI | Overall PCI | |
|---|---|---|
| Long-Run Average | 106 | 112 |
| 2018 Annual Average | 243 | 154 |
| 2025 Annual Average | 499 | 165 |
| Peak Value | 1,076 (Apr 2025) | 271 (Mar 2017) |
| Standard Deviation | 97 | 34 |
| Coefficient of Variation | 0.91 | 0.30 |
| Persistence | 0.72 | 0.84 |
This distinction between the two indexes is particularly important in interpreting the 2025 tariff episode. The overall PCI was elevated but not exceptional: Its peak was about 2.4 standard deviations above its long-run mean, which is a level that has been reached several times in the past. The Trade-PCI, by contrast, peaked at about 10 standard deviations above its mean. This suggests that the increase in PCI was likely due to trade policy (and not the other way around).
Why Was the 2025 Episode so Intense?
The policies at the centers of the 2018 and 2025 episodes were very different in terms of scale, scope and evolution. Tariff announcements in 2025 came in several distinct waves. The first went from February through March and resulted in raising the statutory average effective tariff rate (AETR) from 2.3 percent to about 10 percent. It consisted of:
- A 10 percent tariff on imports from China in early February
- 25 percent tariffs on imports from Canada and Mexico and an additional 10 percent on China in early March
- A 25 percent tariff on steel and aluminum by mid-March
The second wave, announced on April 2, was significantly broader and raised the AETR to about 22 percent and involved:
- A 10 percent minimum tariffs imposed on most imports
- Higher rates on selected trading partners, including a 20 percent tariff on the European Union, 34 percent for China, 24 percent for Japan and 46 percent for Vietnam
A third round on April 9 raised tariffs on China even further to 145 percent, bringing the AETR to 27.5 percent. Taken together, these measures increased average tariffs fifteenfold over the 2024 baseline.
Two features of this sequence help put the Trade-PCI readings in context. Whereas the 2018 tariffs initially focused on particular products and countries, the 2025 tariffs covered nearly all trading partners. Moreover, trade policy continued to change after the initial announcements. Tariffs were announced, raised, paused and then decreased. Other countries retaliated by increasing tariffs to U.S. imports or restricting their import and export quotas. The Trade-PCI reached its peak in April, coinciding with the announcement of the global tariff plan, but it remained elevated as trade policy continued to evolve. A key difference between the 2025 episode and previous ones is that political conflict did not simply spike and then subside. It remained elevated amid a prolonged period of policy uncertainty and change.
Political Conflict Is Different From the Realized Effects of Tariffs
It is important to distinguish the political conflict captured by the Trade-PCI from the economic effects of tariffs. Announced tariff rates in 2025 were substantially higher than the duties ultimately collected. For example, the average AETR (computed from official announcements) was 17.5 percent in May 2025. However, when looking at the duties actually collected as a percentage of imports, the realized tariff rate was just 8.7 percent. Among other things, the gap reflected sourcing changes, exemptions, shipment timing and the delayed implementation in customs systems. A 2026 paper found that — across the 2018-19 and 2025 episodes — shipping lags, exemptions and enforcement gaps kept realized rates near half of statutory rates, while pass-through into U.S. import prices was high at about 92 percent.2
Available evidence also suggests that the effects on employment and prices were smaller and slower than the announced measures would imply. My 2026 working paper "U.S. Import Tariffs in 2025: Realized Tariff Rates, Import Prices and Local Labor-Market Effects," co-authored with Jacob Titcomb, finds that the 2025 tariffs had relatively small effects on local labor markets. Foreign suppliers' prices (excluding tariffs) changed little in the aggregate through 2025, while consumer-price effects were concentrated in trade-intensive durable goods. By August 2025, only about one-third of the tariffs' predicted price effect had reached consumers.3
These findings reinforce the distinction between the political and economic dimensions of the episode. The Trade-PCI does not measure how much tariffs ultimately changed prices, employment or output at that moment in time. It measures the intensity and persistence of the political dispute surrounding trade policy. That information can be useful because political conflict may affect economic decisions in the years to come, and well before the ultimate effects of a policy are fully observed.
Why Persistent Trade Conflict May Matter for Investment
The Trade-PCI was originally developed to study whether partisan conflict over trade policy affects FDI. Foreign investors must commit capital — such as through building a plant or acquiring a business — for long horizons and cannot easily reverse decisions. The predictability of trade policy is extremely relevant to these decisions, as uncertainty may delay or even reverse foreign investment decisions.
My 2018 paper "The Politics of FDI Expropriation" found that, after controlling for standard determinants of capital flows, increases in the Trade-PCI in a given quarter are followed by lower FDI inflows to the U.S. in the subsequent quarter. This evidence provides one reason why persistent conflict over trade policy may matter even before changes in trade policy are fully reflected in trade flows or economic outcomes.
From 2000 to 2017, tariffs were generally low and stable, and trade agreements were expanding. However, the period from 2018 onward told a different story: Tariffs rose, and trade policy became a recurring subject of political dispute. Figure 5 shows that average Trade-PCI increased from 74 to 165 between these two periods, whereas the ratio of FDI inflows to GDP decreased from 1.58 percent to 1.10 percent, on average.
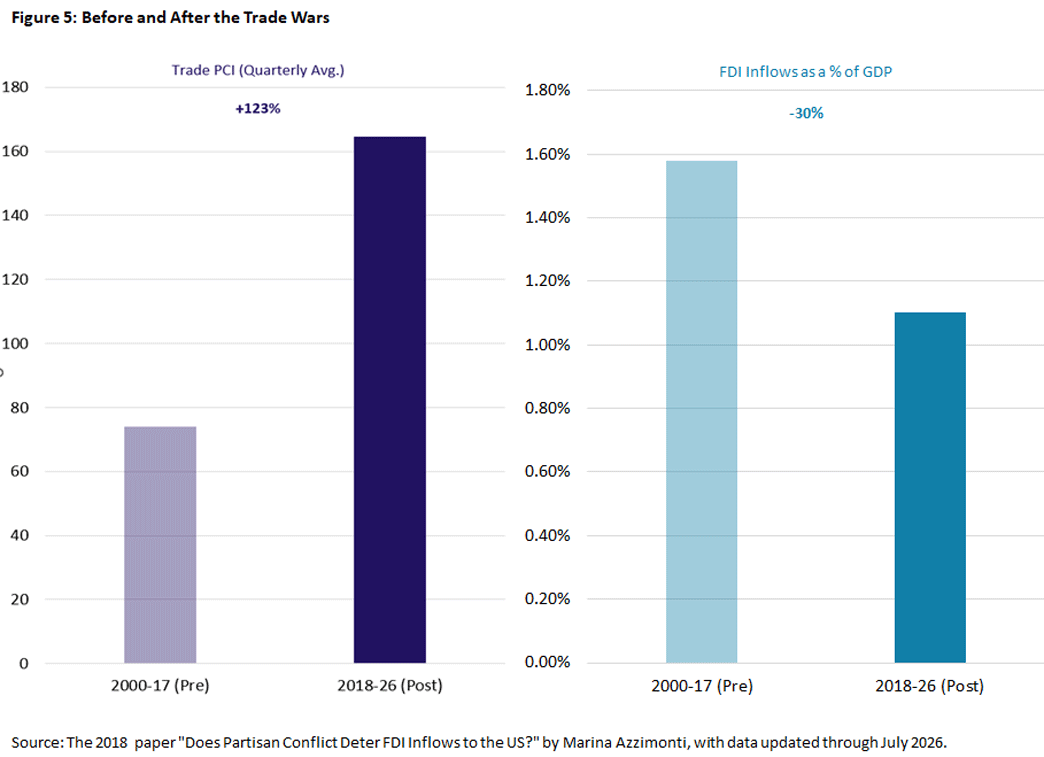
This comparison is descriptive, but it is not causal. FDI responds to many other factors, including global investment conditions, tax policy and exchange rates. Of particular importance was the disruption of supply chains generated by the pandemic. In general, the quarter-to-quarter co-movement between the two series is weak. The pattern in Figure 5 is nevertheless consistent with the mechanism the Trade-PCI was designed to capture: A more uncertain trade-policy environment may weigh on longer-term investment decisions.
Putting 2025 in Perspective
The historical record shows that partisan conflict over trade is not new. Trade has repeatedly become a major source of political disagreement around important policy decisions, including GATT, NAFTA, the TPP and the 2018 tariff episode.
What distinguishes 2025 is the breadth and persistence of the conflict. The Trade-PCI reached its highest value since 1981, exceeding its historical 90th percentile every month of 2025. At the same time, the overall PCI did not increase nearly as much. The exceptional conflict among lawmakers was specifically about trade policy.
The Trade-PCI provides information that tariff rates and trade flows do not. Instead, those measures describe the policies that are implemented and the consequences of those policies. The Trade-PCI measures the intensity of the political conflict surrounding such policies, including periods when policy is being proposed, debated, revised or contested. By that measure, 2025 was not simply another episode of trade conflict. It was an unusually intense and persistent period of partisan disagreement over trade policy.
Marina Azzimonti is a senior economist and research advisor in the Research Department at the Federal Reserve Bank of Richmond.
1
For more on the PCI, see my 2018 papers "Partisan Conflict and Private Investment" and "The Politics of FDI Exploration" and my 2023 article "Partisan Conflict in the U.S. and Potential Impacts on the Economy."
2
See the 2026 paper "The Incidence of Tariffs: Rates and Reality" by Gita Gopinath and Brent Neiman.
3
See the 2025 article "How Tariffs Are Affecting Prices in 2025" by Maximiliano Dvorkin, Fernando Leibovici and Ana Maria Santacreu.
To cite this Economic Brief, please use the following format: Azzimonti, Marina. (October 2026) "Partisan Conflict Over Trade Policy." Federal Reserve Bank of Richmond Economic Brief, No. 26-33.
This article may be photocopied or reprinted in its entirety. Please credit the author, source, and the Federal Reserve Bank of Richmond and include the italicized statement below.
Views expressed in this article are those of the author and not necessarily those of the Federal Reserve Bank of Richmond or the Federal Reserve System.


Subscribe to Economic Brief
Receive a notification when Economic Brief is posted online.
Contact Us