Why Predicted and Actual Tariff Rates Diverged in May 2025
Economic Brief
August 2025, No. 25-29
Key Takeaways
- The predicted average effective tariff rate (AETR) for May 2025 was 17.5 percent, but the actual AETR was only 8.7 percent. This large gap motivated a systematic decomposition of the sources of divergence.
- Shifts in importer behavior — such as changes in sourcing strategies and product composition — account for part of the gap. In particular, imports from China and other high-tariff countries fell sharply, while imports from lower-tariff countries like Vietnam increased.
- The largest factor seems to be implementation frictions. Many country-product pairs that were expected to be tariffed either generated no duties or much lower-than-expected collections, likely due to legacy exemptions, shipping timing and delays in customs system updates.
In May, the average effective tariff rate (AETR) implied by announced tariff policies — which I call the "predicted AETR" — stood at 17.5 percent. Yet, the actual AETR calculated from the Census Bureau's May trade data was just 8.7 percent. This 8.8-percentage-point gap raises important questions about how tariffs are implemented and how businesses respond to policy changes. This article uses detailed product-level and country-level trade and tariff data to unpack the sources of this discrepancy.
I find that part of the gap reflects real shifts in importer behavior, including changes in sourcing strategies and product composition. For instance, importers moved away from heavily tariffed goods, or they switched to suppliers in lower-tariff countries, such as Vietnam.
Yet, the dominant factor behind the gap was implementation frictions. Many goods that were expected to face high tariffs either generated no duties or yielded much lower-than-anticipated collections. These shortfalls likely reflect a mix of legacy exemptions, shipment timing issues, deferred payments and delays in customs systems adapting to the new tariff schedule.
A deeper look at industry-level patterns further confirms that these frictions were both widespread and economically significant. A sectoral decomposition reveals particularly large implementation frictions in high-import industries such as electronics, electrical equipment and machinery. In these sectors, predicted tariffs were high, but most imported products failed to generate commensurate duty payments. These two factors amplified the sectors' contribution to the overall AETR gap. In contrast, sectors such as transportation equipment — where tariffs were implemented more promptly — show little to no discrepancy.
Understanding these operational gaps is essential for forecasting tariff revenues, assessing near-term price effects and evaluating the broader economic impact of trade policy changes. If the discrepancies observed in May reflect only temporary lags in enforcement, we would expect the realized AETR to rise in the coming months, potentially converging toward 14 percent given the May import mix. Continued monitoring will be necessary to track this adjustment and gauge the effectiveness of tariff policy implementation going forward.
Computing Predicted and Actual AETRs
To generate the predicted AETR, I apply country-product specific tariffs that were both announced and in effect as of May 2025 to detailed 2024 trade data. For example, if the product "Aluminum bars, rods and profiles: of aluminum, not alloyed" — which as of May 2025 was subject to a 25 percent tariff under Section 232 — is imported from a country that faced a 2 percent tariff in 2024, the predicted tariff rate for that product-country pair would be 27 percent. This is because the executive order specified that the new tariff should be applied in addition to the Most Favored Nation rate already in place for that subheading (thus, "stacking" the tariff rates).1
I then aggregate across goods and countries using 2024 country-level import shares and 2024 within-country product composition to construct a single economy-wide AETR estimate. Since the predicted AETR uses tariff announcements in real time, I refer to it as a forward-looking measure representing our "best guess" of what average tariffs will be. I compute in this manner because there is a two-month lag between the period in which I need to use the data and the period in which I can collect it from the Census Bureau. For example, the latest import and tariff data release I currently have is from May.
The actual AETR was computed directly as the ratio of total duties collected to the total value of imports, providing a straightforward, backward-looking measure. As of May, this realized AETR was 8.7 percent, despite minimal policy changes during the month.
Understanding the Gap: Three Hypotheses
Given the structure of these measures, the predicted/actual AETR discrepancy can arise from three main sources:
- Within-country changes in the product mix: This may be due to importers reducing (or eliminating) volumes of highly tariffed goods, moving up purchases before the tariffs take effect or renegotiating prices with providers (thus, "sharing" the tariff burden).
- Shifts across country import shares: This may be especially true for firms moving away from high-tariff countries such as China and toward lower-tariff sources like Vietnam or toward domestic alternatives or foreign alternatives not subject to tariffs.
- Tariff collection dynamics: This includes the timing of shipments, exemptions not captured in announced-policy data, ongoing litigation on which goods could be subject to tariffs, or other mechanisms preventing full tariff implementation.
I will refer to these sources as "hypotheses" and try to tease out which one of these is the most likely cause of the gap. Evidence for hypothesis 1 comes from the most recent CFO Survey, where 24.6 percent of respondents said they would "move up purchases" and 12.4 percent said they would "scale down businesses." The survey also provides some evidence for hypothesis 2, as respondents reported that the number of goods purchased from the U.S. increased and the number purchased from outside the U.S. declined. This indicates substitution to domestic alternatives.
Figure 1 compares country-level import shares in 2024 to those observed in May 2025. The data reveal a marked decline in imports from high-tariff countries such as China and Canada — which have reductions of 45 percent and 14 percent, respectively, relative to 2024 — alongside a notable increase in imports from Vietnam, the European Union (EU) and the rest of the world (ROW) category.
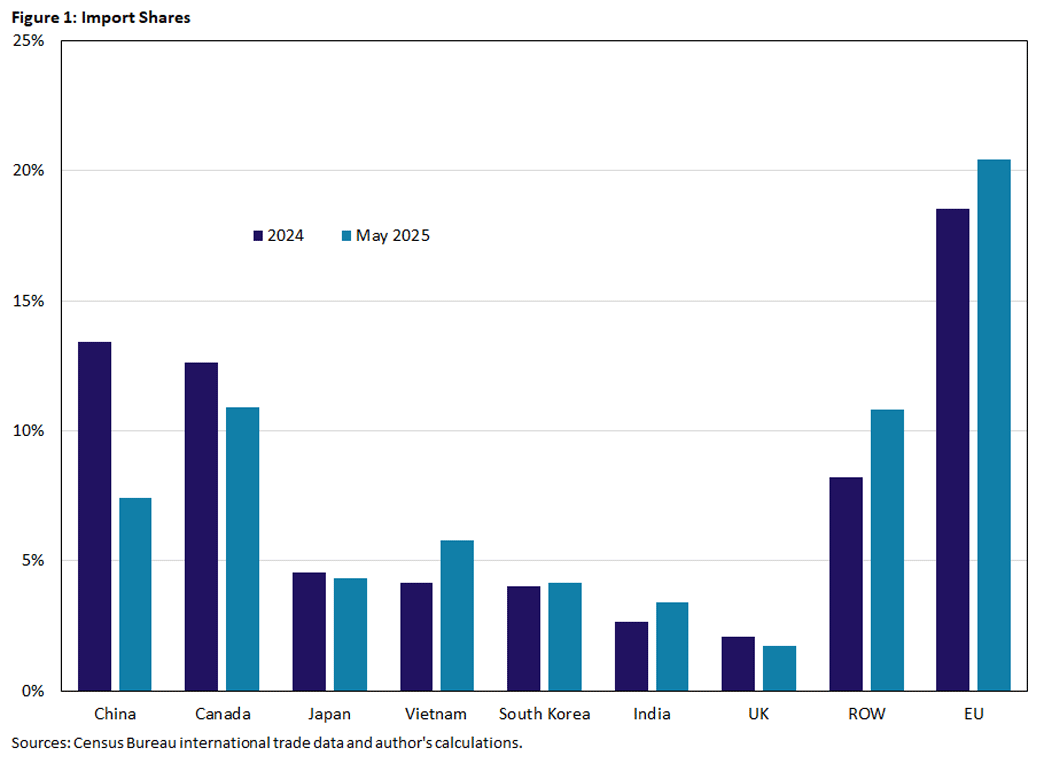
These shifts are consistent with cross-country substitution, where importers reallocated sourcing toward countries less affected by the 2025 tariff actions. In particular, the rise in Vietnam's share of imports (from 4 percent to over 6 percent) likely reflects its position as a lower-tariff alternative to China in many product categories. Likewise, the expansion of EU and ROW shares suggests broader diversification in sourcing strategies. Among respondents in the CFO Survey, 27 percent claimed that they would likely diversify their supply chains later in the year. These compositional changes contributed to a measurable reduction in the predicted AETR when I reweighted using updated 2025 import shares, as I will show later.
Hypothesis 3 considers possible delays in tariff collection due to the following:
Shipment Delays
Since goods that had already been shipped were exempt from the new tariffs — and shipping from countries such as China typically takes about a month — the tariff increases likely only began affecting imports that arrived in mid-May.
Delayed Payments
U.S. Customs and Border Protection allows importers enrolled in the automated clearinghouse (ACH) payment system to defer tariff payments by up to six weeks. As a result, many shipments that arrived in May would not have triggered tariff payments until June, delaying the fiscal impact of newly imposed duties.
Ongoing Litigation
In mid-May, five U.S. small businesses filed a case in the U.S. Court of International Trade seeking to block the April 2 "Liberation Day" tariffs.2 These businesses argued that the unilateral presidential action exceeded statutory authority. On May 28, the Court of International Trade ruled that the broad tariffs imposed under the International Emergency Economic Powers Act (including the "Liberation Day" tariffs) exceeded the President's constitutional authority.3 These may have caused pauses or confusion in the implementation of tariffs at the border.
Decomposition Analysis
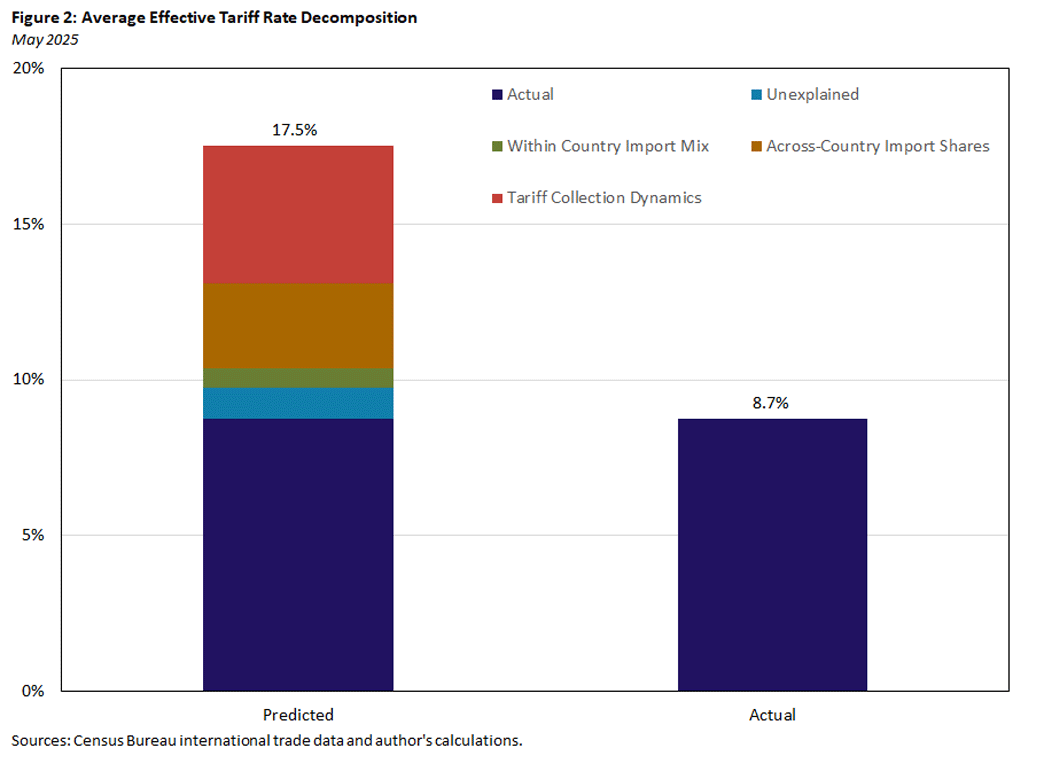
To quantify the impact of each of the three hypotheses described above, I conduct the following decomposition, illustrated in Figure 2:
Within-Country Changes in the Product Mix
Updating the product-level weights within each country using May 2025 trade flows (instead of 2024 levels) resulted in a modest reduction of 0.6 percentage points in the AETR.4 This suggests that product substitution is present but played a relatively minor role in explaining the overall gap.
Across Country Import Share Shifts
Replacing 2024 country weights with those from May 2025 had a larger effect than replacing product-level weights, reducing the AETR by 2.7 percentage points. Most notably, U.S. imports from China declined, while imports from Vietnam and the EU increased. This substitution away from heavily tariffed countries had a noticeable impact but is still insufficient to explain the full gap.
Tariff Collection Dynamics
To account for legacy exemptions or treaties as well as delays in tariff implementation, I flag any country-product pair that met the following criteria:
- It had positive import values in May 2025.
- It was exempt from tariffs in 2024.
- It showed a discrepancy greater than 0.5 percentage points between predicted and actual tariff rates per product-country pair in May 2025.
For these items, I adjust the applied tariff to zero. Incorporating these partial or missed collections brings the predicted AETR for May (adjusted for implementation gaps) to 9.7 percent, reducing the gap considerably.
Additional Considerations
The remaining unexplained residual is now about 1 percentage point, suggesting that most of the divergence can be attributed to legacy exemptions and implementation lags rather than errors in the underlying tariff predictions.
If instead of assigning a zero tariff in this third experiment I had assigned the actual collected tariff rates observed in May 2025 for the relevant items, the resulting AETR would have been 10.1 percent. This suggests that, for many of these goods, tariff collections were minimal, likely due to implementation delays, administrative issues or incomplete updates to customs systems. In fact, a significant number of country-product pairs that were expected to be tariffed at high rates had zero recorded tariff collections in May. This pattern indicates that the tariff schedule may not have been fully integrated into operational procedures, leading to lags in enforcement rather than strategic payment deferrals by importers.
Figure 2 displays the breakdown of the contributions of these hypotheses.
Case Study: Canada
To better understand these discrepancies, I took a closer look at Canada. While the predicted AETR for Canadian imports was 10.4 percent, the actual rate recorded in May 2025 was just 1.9 percent. To investigate why, I examine the universe of imported items from Canada and identify those with positive predicted tariffs but no corresponding duty collections despite having positive import volumes that month.
The analysis revealed that 1,254 out of 5,284 imported product lines (roughly 31 percent) fell into this category. In other words, nearly one-third of Canadian imports that were expected to be subject to tariffs generated zero tariff revenue in May, suggesting either legacy exemptions, delayed implementation or administrative gaps in enforcement.
Setting the AETR to zero on the imports that went untariffed would raise the adjusted AETR to 5 percent. However, including undercollected but nonzero items results in a more realistic adjustment of 2.5 percent, closer to the observed 1.9 percent.
Was this discrepancy due to incorrect predictions, or did it stem from issues with tariff implementation? To explore this, Table 1 shows the top Canadian imports by value in May 2025, comparing predicted and actual tariff collections. The evidence points strongly toward implementation challenges as a key driver of the gap in tariff revenue.
Take, for example, the item highlighted in red: aircraft between 2,000 and 15,000 kilograms. According to the U.S. tariff lookup tool available through Canada's official trade portal, this product was not covered by the United States-Mexico-Canada Agreement and was subject to the general 25 percent tariff on nonexempt Canadian goods.
| HTS6 | Commodity | Imports (Millions) | Duties (Millions) | Weight in CA Imports | Actual AETR | Predicted AETR |
|---|---|---|---|---|---|---|
| 940320 | Metal Furniture Nesoi | $26.04 | $2.55 | 0.1% | 10% | 25% |
| 030612 | Lobsters, Including in Shell, Frozen | $76.31 | $0.00 | 0.3% | 0% | 25% |
| 940199 | Parts of Seats, Nesoi | $57.18 | $2.39 | 0.2% | 4% | 25% |
| 281410 | Anhydrous Ammonia | $63.44 | $0.00 | 0.2% | 0% | 25% |
| 480261 | Paper & Paperboard, Uncoated, 10% Mech.fib.,rolls | $49.04 | $0.00 | 0.2% | 0% | 25% |
| 750210 | Nickel, Unwrought, Not Alloyed | $50.99 | $0.00 | 0.2% | 0% | 25% |
| 760200 | Aluminum Waste and Scrap | $88.08 | $0.08 | 0.3% | 0% | 25% |
| 851762 | Mach for Recp/convr/trans/regn of Voice/image/data | $60.78 | $4.24 | 0.2% | 7% | 25% |
| 330499 | Beauty & Skin Care Preparation, Nesoi | $64.66 | $0.20 | 0.2% | 0% | 25% |
| 290110 | Acyclic Hydrocarbons, Saturated | $40.78 | $0.00 | 0.1% | 0% | 25% |
| 880730 | Parts of Planes or Helicopters, Nesoi | $122.93 | $9.89 | 0.4% | 8% | 25% |
| 841191 | Turbojet and Turboproller Parts | $121.83 | $9.99 | 0.4% | 8% | 25% |
| 470321 | Chemical Woodpulp, Soda Etc. N Dis S Bl & Bl Conif | $105.89 | $0.00 | 0.4% | 0% | 25% |
| 880230 | Airplane & A/c Unladen Wght > 2000, Nov 15000 Kg | $74.08 | $0.00 | 0.2% | 0% | 25% |
| 841112 | Turbojets of a Thrust Exceeding 25 Kn | $360.95 | $0.00 | 1.2% | 0% | 25% |
| 880240 | Airplane & Ot A/c, Unladen Weight > 15,000 Kg | $186.02 | $0.00 | 0.6% | 0% | 25% |
Based on those parameters, the predicted AETR for this item was 25 percent. However, actual duty collections were zero, despite over $74 million in imports recorded for May. This suggests that — at least for a significant subset of high-value imports — the problem was not in the prediction model but rather in how (or whether) the tariffs were applied at the border.
Shipment Timing and Deferred Tariff Payments
To further investigate whether the gap between predicted and actual AETRs stemmed from shipment timing or deferred tariff payments, I conduct a second experiment. Specifically, I focus on products that met three criteria:
- They were not subject to tariffs in 2024.
- They had positive import values and nonzero duty collections in May 2025.
- The actual tariffs collected were significantly below expectations, defined here as more than 5 percentage points lower than the predicted rate.
Roughly 26 percent of products fell into this category. One illustrative example from Table 1 is the beauty and skin care preparation category. Although products in this category were expected to face a 25 percent tariff in May, the actual rate based on collections was only 0.2 percent.
Including these undercollected items alongside the fully uncollected ones from the earlier analysis, the adjusted AETR for Canada rises to approximately 2.5 percent — closer to the observed value of 1.9 percent. This suggests that delays in enforcement or deferred payments may have played a substantial role in the observed discrepancy.
Industry Analysis
To better understand which sectors drove the gap between predicted and actual tariff rates, I conduct an industry-level decomposition using NAICS-3 sector classifications. For each industry, I calculate its share of total U.S. imports in May 2025 and measure the difference between the predicted and actual AETR. This approach helps identify which sectors contributed most to the aggregate AETR gap, either because they represent a large share of imports or because they experienced unusually large discrepancies between expected and realized tariff payments.
Figure 3 plots the difference between predicted and actual AETRs by industry, with the horizontal axis capturing each industry's import share and the vertical axis showing the predicted-minus-actual AETR gap. Each circle represents an industry, and its size is proportional to the industry's import share. This visualization highlights not only which sectors experienced large tariff discrepancies but also which were most consequential in aggregate.
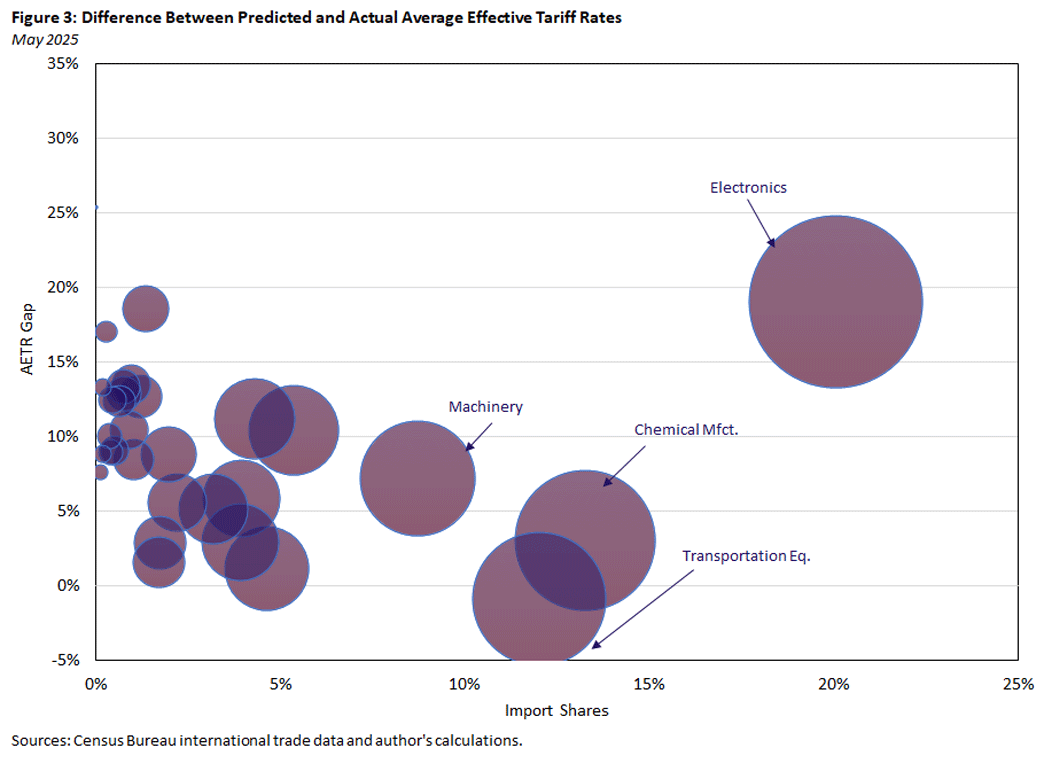
Three of the largest importing industries stand out for having substantial enforcement gaps: electronics (19 percentage points); electrical equipment, appliances and components (10 percentage points); and machinery (7 percentage points). These gaps appear to be broad based within each sector. In both electronics and machinery, more than 60 percent of the imported product lines had individual AETR gaps exceeding 5 percentage points. Another telling case is the oil and gas industry, where key products such as liquefied natural gas, propane and butane (primarily imported from Canada) should have faced 10 percent tariffs but registered zero duty collections in May 2025.
By contrast, the transportation equipment industry shows almost no discrepancy between predicted and actual AETRs despite its large import share, suggesting that tariffs were implemented more completely in this sector.
Several smaller industries — such as furniture, beverages and tobacco, wood products, paper, and textiles — also exhibit sizable tariff gaps. While these industries individually account for smaller shares of total imports, their consistent undercollection across products signals broader implementation frictions.
Taken together, the evidence points to widespread but uneven enforcement issues, with particularly pronounced gaps in high-volume industries like electronics and machinery. These implementation shortfalls likely account for a significant portion of the overall divergence between predicted and realized trade costs.
Conclusion
The sizable gap between the predicted and actual AETRs in May 2025 — 17.5 percent versus 8.7 percent — can be largely attributed to a combination of importer adjustments and, more importantly, delays in translating announced tariffs into actual collections. While shifts in sourcing strategies and product composition played a role, the decomposition analysis points to implementation frictions — such as legacy exemptions, deferred payments and customs system delays — as the dominant causes of the shortfall. These frictions are not visible in published tariff schedules but materially affected collections in May.
If May was a transitional month — reflecting administrative lags, payment deferrals or shipments in transit prior to the policy's effective date — then the data from June 2025 will provide a more accurate picture of the true fiscal impact of the new tariff regime. Based on the observed May import mix, the realized AETR could plausibly rise to 10 to 14 percent once enforcement aligns with announced policy. Continued monitoring will be critical in determining whether this convergence occurs and in gauging the durability and macroeconomic significance of the current trade policy.
Marina Azzimonti is a senior economist and research advisor in the Research Department at the Federal Reserve Bank of Richmond.
1
The computation is actually more complicated than this example, since subsequent executive orders specified that not all 2025 tariffs would stack up. For example, a car part that uses aluminum is not subject to the 25 percent aluminum plus the 25 percent car part tariffs. These exemptions were incorporated into our calculations to our best interpretation of the law.
2
For more information, see the May 2025 article "Small Businesses Press US Trade Court to Block Trump Tariffs" by Dietrich Knauth and Blake Brittain.
3
For more information, see the May 2025 article "US Court Blocks Most Trump Tariffs, Says President Exceeded His Authority" by Dietrich Knauth and Daniel Wiessner.
4
In this exercise, the import shares are kept constant at 2024 levels. Only the import mix within each country is updated to May 2025.
To cite this Economic Brief, please use the following format: Azzimonti, Marina. (August 2025) "Why Predicted and Actual Tariff Rates Diverged in May 2025." Federal Reserve Bank of Richmond Economic Brief, No. 25-29.
This article may be photocopied or reprinted in its entirety. Please credit the author, source, and the Federal Reserve Bank of Richmond and include the italicized statement below.
Views expressed in this article are those of the author and not necessarily those of the Federal Reserve Bank of Richmond or the Federal Reserve System.
Subscribe to Economic Brief
Receive a notification when Economic Brief is posted online.
Contact Us