Core Confusion: Making Sense of Multiple Inflation Metrics
Macro Minute
May 5, 2026
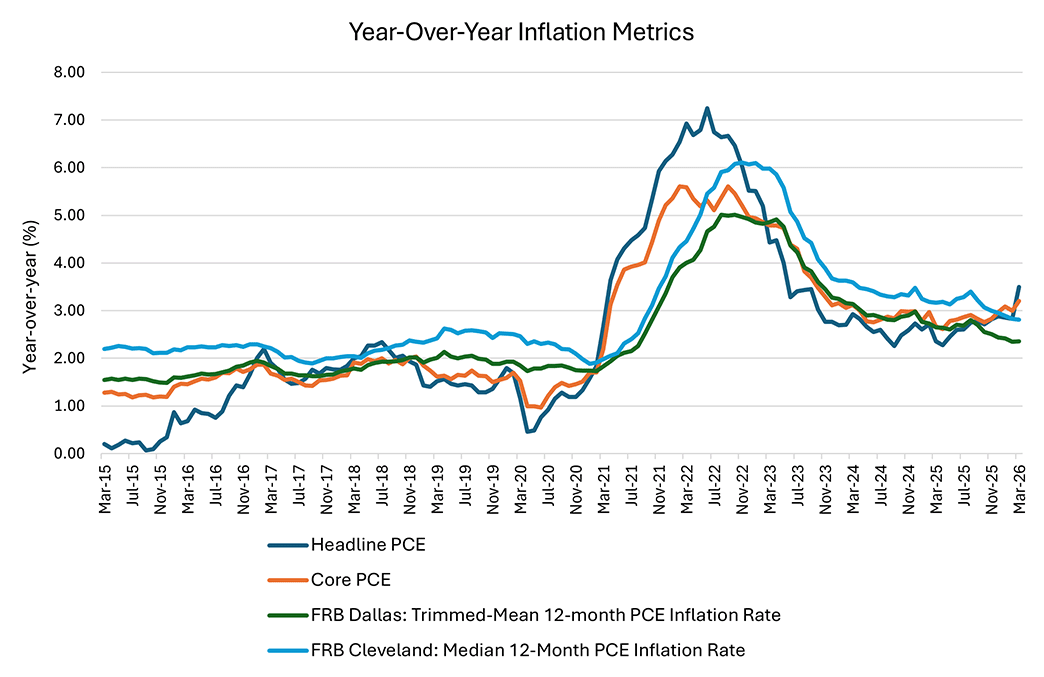
Different measures of inflation tell different stories about how fast consumer prices are growing. In March, headline PCE prices rose 0.7 percent month over month, while the year-over-year headline inflation measure came in at 3.5 percent. Core PCE prices rose 0.3 percent month over month, with the year-over-year core inflation rate at 3.2 percent.
Alternative measures of inflation are also available. For example, median PCE inflation rose at an annualized pace of 3.3 percent in March, with the year-over-year rate at 2.8 percent. In contrast, the Dallas Fed trimmed-mean PCE price index rose 2.9 percent at an annualized pace, while the year-over-year rate was 2.4 percent. In this week's post, we'll discuss how these alternative inflation measures differ from the standard headline and core PCE inflation measures, and we'll raise some considerations that stem from interpreting inflation signals from these alternative measures.
The Dallas Fed trimmed-mean PCE measure chops off the top 31 percent of the fastest-growing price categories and the bottom 24 percent of the slowest-growing price categories. These cutoffs were chosen such that the resulting trimmed-mean PCE best fits several different smoothed measures of inflation between 1977 and 2009. Median PCE inflation can be thought of as a type of trimmed-mean which symmetrically chops off the top and bottom 50 percent of categories sorted by spending-weighted growth rates, leaving only the category directly in the middle.
As discussed in our very first Macro Minute post, one potential limitation of trimming price categories is that generalized inflation might initially start in a couple categories before expanding to more consumption categories. Chopping off these initial categories would mean missing an early warning signal of inflation. Trimmed-mean measures would then be a lagging indicator of inflation pressure.
As shown in Figure 1 below, when inflation began rising in 2021, the headline and core PCE measures rose and peaked earlier than the trimmed-mean and median PCE inflation measures. Because asymmetric cut points favor cutting off more of the largest price changes than the smallest, the asymmetric approach is arguably more susceptible to this problem compared to symmetric trimmed-mean measures.
Another potential limitation of trimmed-mean inflation is that the cut points at which price categories are trimmed have been set based on a historical sample which may not be representative of economic conditions going forward. For example, research by Kristin Forbes, Jongrim Ha and M. Ayhan Kose suggests that global shocks — which are more supply-driven and which have more persistent effects on inflation — became more common between 1970 and 2024. It is possible that trimmed-mean cut-points — which have been set based on the earlier years of that sample — may not necessarily be the same as those that would have been chosen in the later years of the sample. In fact, a recent article by Dallas Fed economists argues that the Dallas Fed trimmed-mean measure was downwardly biased when price changes become more positively skewed during the inflation rise of 2021. This article goes on to warn that this situation could recur amid supply disruptions related to the conflict in the Middle East.
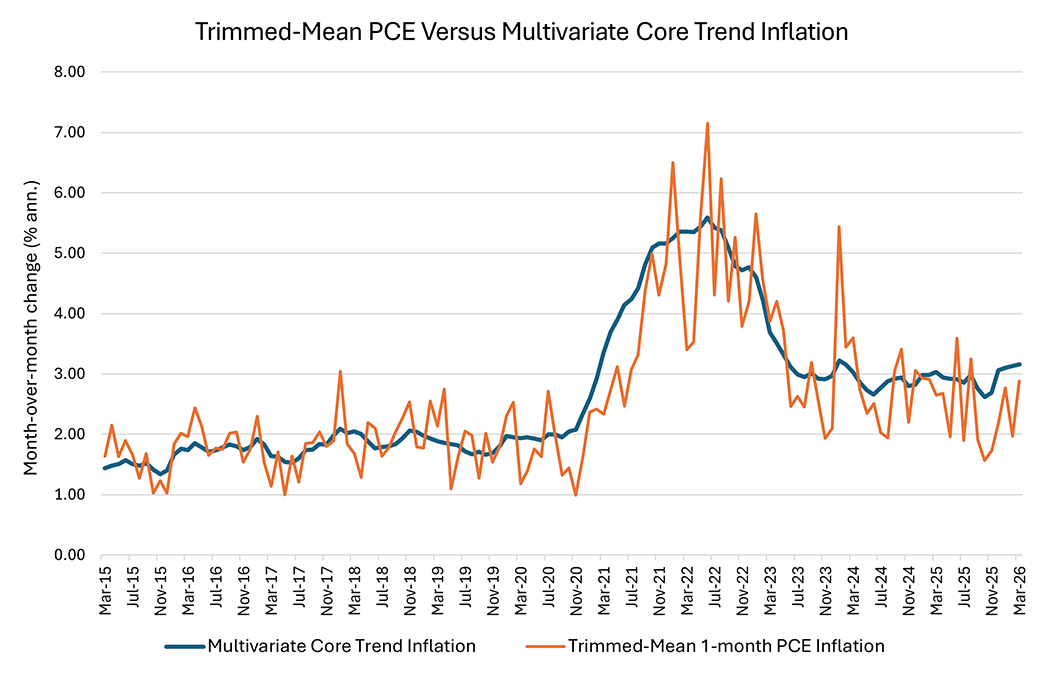
To assess this, one could compare inflation signals from trimmed-mean PCE against inflation signals given by the Multivariate Core Trend (MCT) inflation measure, another alternative measure of core inflation. Like trimmed-mean, MCT extracts information about underlying inflation from disaggregated price categories, although it uses a rougher disaggregation with fewer price categories compared to the trimmed-mean measure. However, in contrast to trimmed-mean, the MCT doesn't rely on fixed cut-point thresholds obtained from a historical sample. Instead, it uses a dynamic model with time-varying parameters to identify a common inflation trend.
As shown in Figure 2 below, MCT inflation has recently been running above the Dallas Fed trimmed-mean. Interestingly, this was also the case when inflation began rising in 2021.
This analysis reveals that it can be helpful to consider a broad constellation of inflation measures to obtain a more robust diagnosis of inflation pressure affecting the U.S. economy.
Views expressed in this article are those of the author and not necessarily those of the Federal Reserve Bank of Richmond or the Federal Reserve System.
Contact Us