Selective Spending Squeeze
Macro Minute
May 12, 2026
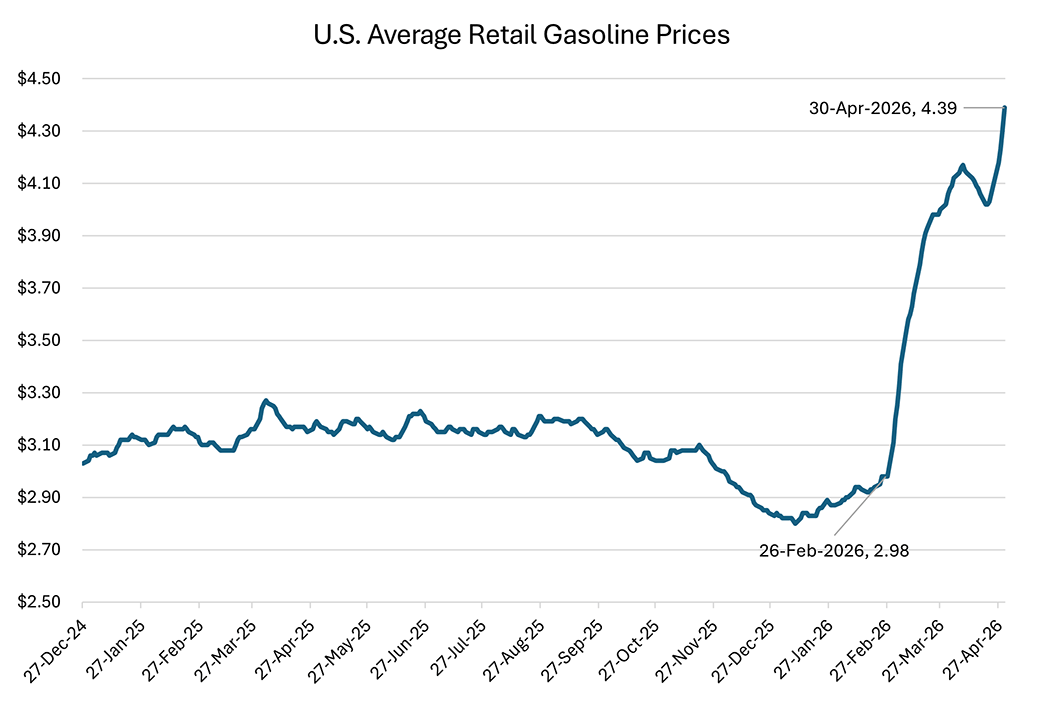
According to data from AAA and compiled by the U.S. Energy Information Administration, average retail gasoline prices rose from $2.98 per gallon on Feb. 26 (before the Iran conflict) to $4.39 per gallon on April 30. Since gasoline is a nondiscretionary item for households that need to drive to work, to hospitals, or to the grocery store, many households are now less able to purchase the same quantities of discretionary goods and services they enjoyed before the energy shock. In this week's post, we explore how these choices have left an imprint on March's personal consumption expenditures report.
To visualize how rapidly rising gas prices have created an unexpected surge in energy purchases, Figure 2 below plots nominal expenditure on gasoline and other energy goods against a forecast from before the Iran conflict. The forecast (the orange line) and associated 68 percent confidence interval is calculated based on data from the period January 2023-December 2025 and extends through December 2026. The blue line shows that monthly actual expenditure on energy in March 2026 is well above levels that would have been forecasted based on the prior three-year trend.

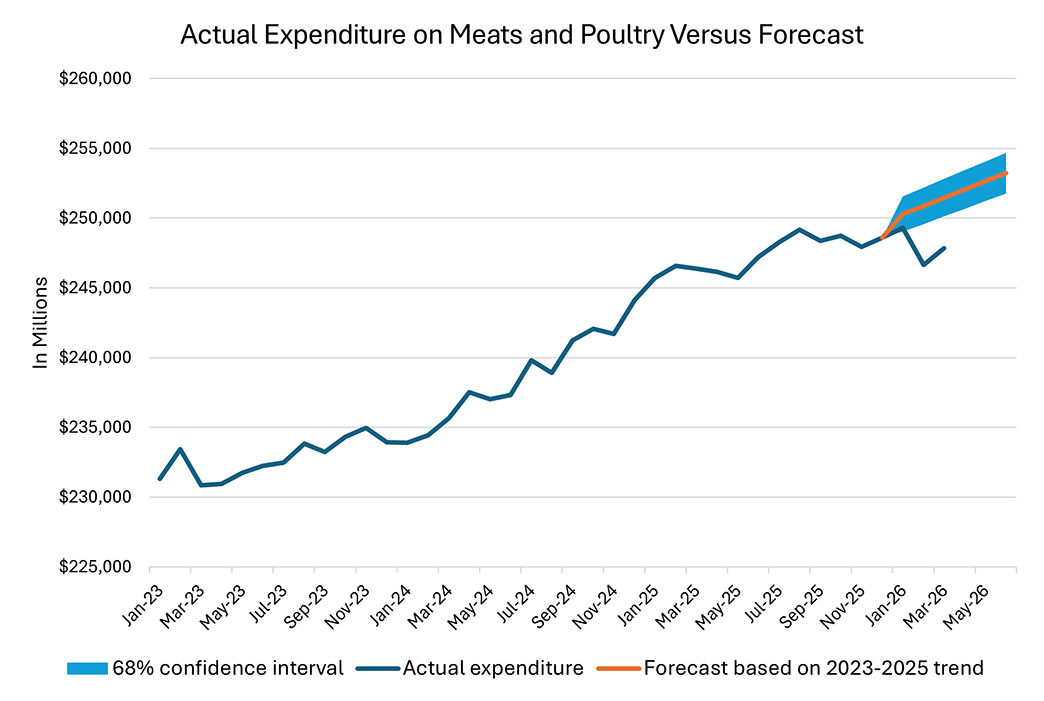
If gasoline expenditures have been unexpectedly high in March, are there any categories where we are seeing unexpected weakness? Incoming data suggest that shoppers may be cutting back on grocery expenses. Figure 3 below shows nominal personal consumption expenditures on meats and poultry compared to the pre-oil-shock forecast. Meat and poultry expenditure in February and March 2026 has been below what would have been predicted based on the 2023-2025 trend.
Groceries are not the only category where households seem to be cutting back. Table 1 below lists nominal expenditure amounts from selected categories from the BEA's table of personal consumption expenditure by major products, along with pre-oil-shock forecast intervals. Health expenditures, food services and accommodations, and net foreign travel also saw expenditure levels in March that were outside of (and lower than) their pre-oil-shock forecast intervals for the month. At the same time, some expenditure categories — including motor vehicles and parts, and recreation — were stronger than their respective forecasts, showing that consumer pullback is selective and some spending remained strong in the early weeks of the Iran conflict.
| Category | March 2026 actual ($ Mil.s) | Lower 68% CI | Upper 68% CI |
|---|---|---|---|
| Food & Beverages Purchased for Off-Premises Consumption | 1,547,810 | 1,552,586 | 1,565,629 |
| Meats and Poultry | 247,841 | 250,116 | 252,815 |
| Clothing, Footwear & Related Svc | 614,230 | 609,599 | 619,204 |
| Housing and Utilities | 3,904,530 | 3,898,103 | 3,974,205 |
| Furnishings, HH Eqpt & Routine HH | 855,676 | 832,295 | 849,057 |
| Health | 4,585,561 | 4,604,553 | 4,623,405 |
| Gasoline and Other Energy Goods | 503,683 | 389,618 | 416,769 |
| Transportation | 2,003,862 | 1,844,766 | 1,916,280 |
| Motor Vehicles and Parts | 780,877 | 725,154 | 772,141 |
| Communication | 361,778 | 356,339 | 362,484 |
| Recreation | 2,082,333 | 2,043,918 | 2,067,351 |
| Education | 379,709 | 375,204 | 378,813 |
| Food Services & Accommodations | 1,526,367 | 1,531,535 | 1,550,341 |
| Financial Services & Insurance | 1,822,586 | 1,793,474 | 1,826,979 |
| Other Goods and Services | 1,412,529 | 1,396,530 | 1,410,462 |
| Net Foreign Travel & Exp Abroad by US Residents | 95,353 | 104,129 | 123,039 |
| Source: Author's calculations using Bureau of Economic Analysis data via Haver Analytics | |||
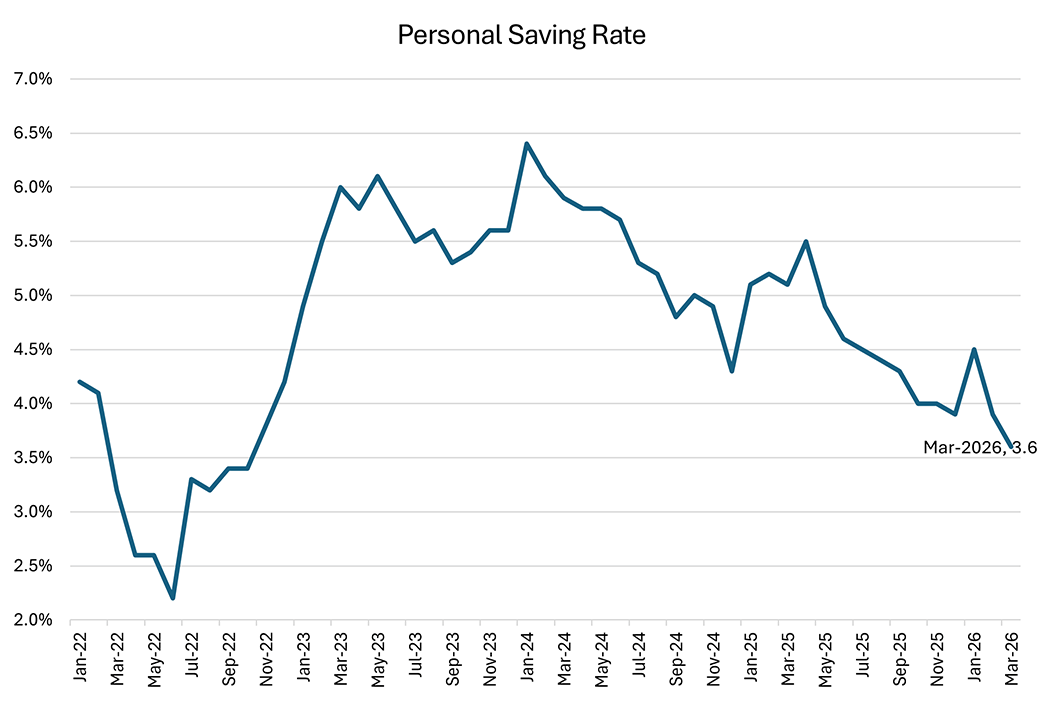
Instead of pulling back on all categories of nonenergy spending, households may be reducing their savings. Figure 4 below shows that the personal saving rate fell to 3.6 percent in March, the lowest since October 2022. These saving and spending choices suggest that consumers' spending appetites may have been disrupted (but not destroyed) by high energy prices.
Views expressed in this article are those of the author and not necessarily those of the Federal Reserve Bank of Richmond or the Federal Reserve System.
Contact Us