Supply Shock Sapping Inventories
Macro Minute
May 19, 2026
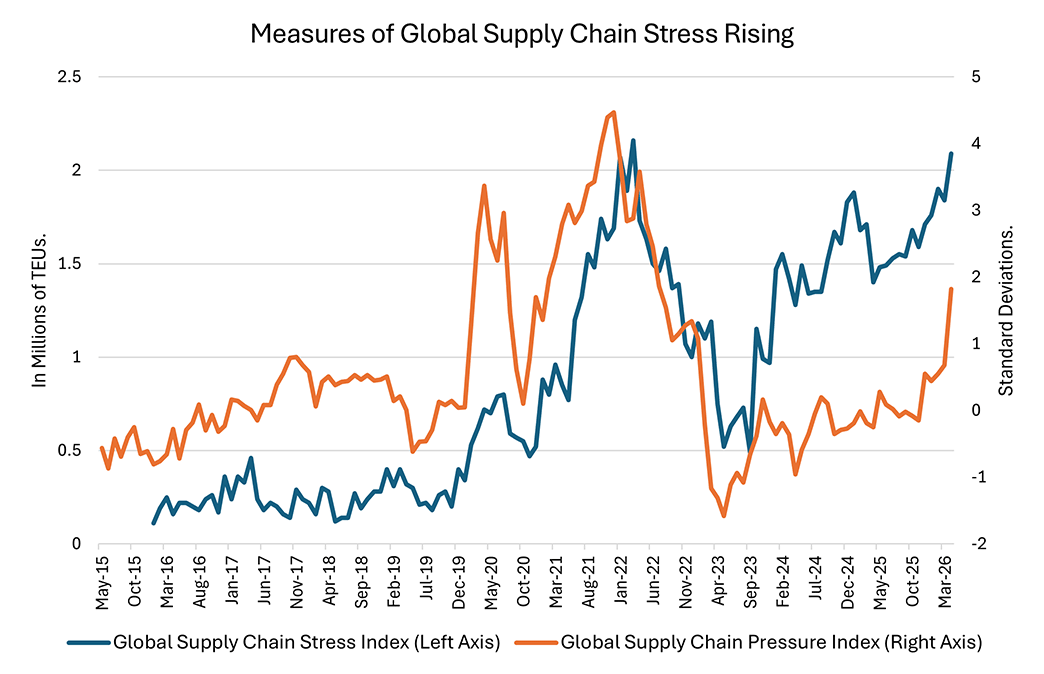
With the conflict in the Middle East affecting shipping and processing of crude oil, aluminum, fertilizers, helium, and other commodities, measures of global supply chain stress are on the rise once again. Figure 1 below shows that both the World Bank's Global Supply Chain Stress Index and the New York Fed's Global Supply Chain Pressure Index have increased to levels last seen in 2022. (For a description of both these indexes, see our 2025 post discussing global supply chain constraints.) This week's post looks at how these global conditions are making an imprint on domestic economic data.
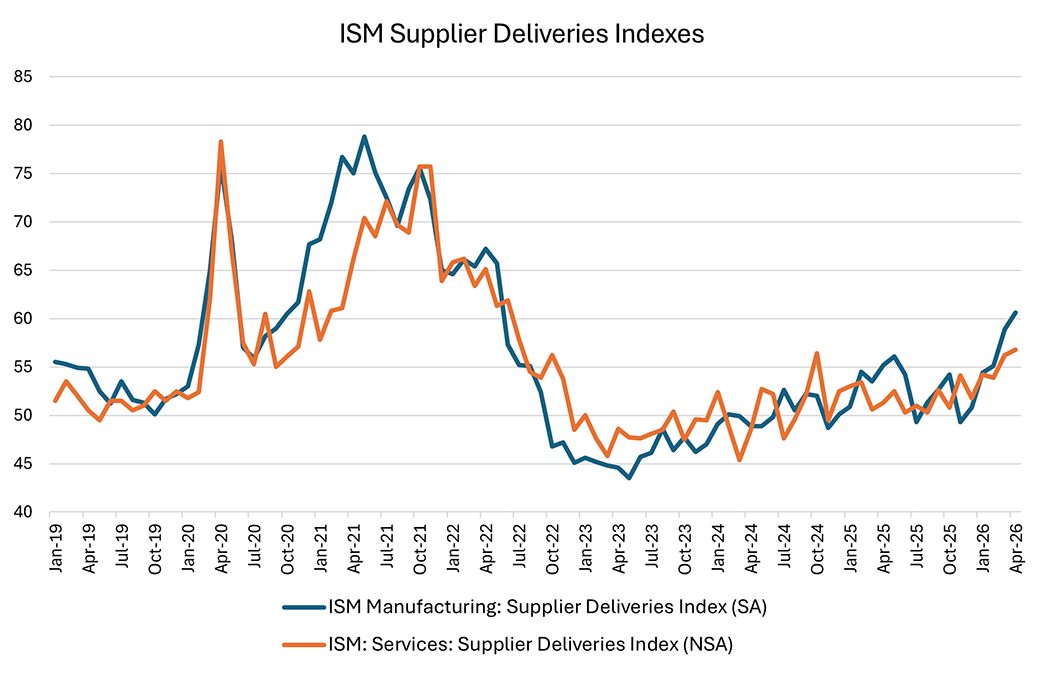
While the supply chain indexes in Figure 1 describe worldwide conditions, economic indicators closer to home have also been affected. As shown in Figure 2 below, the supplier deliveries components of the Institute for Supply Management's (ISM's) purchasing managers' indexes — which are based on surveys of U.S. firms — are beginning to increase for both manufacturers and service-providing businesses. Scores above 50 indicate that suppliers are taking longer to deliver products to businesses. In the latest April survey, both the manufacturing and services series have increased to levels last seen in 2022, with the services index now slightly above a recent peak in October 2024.
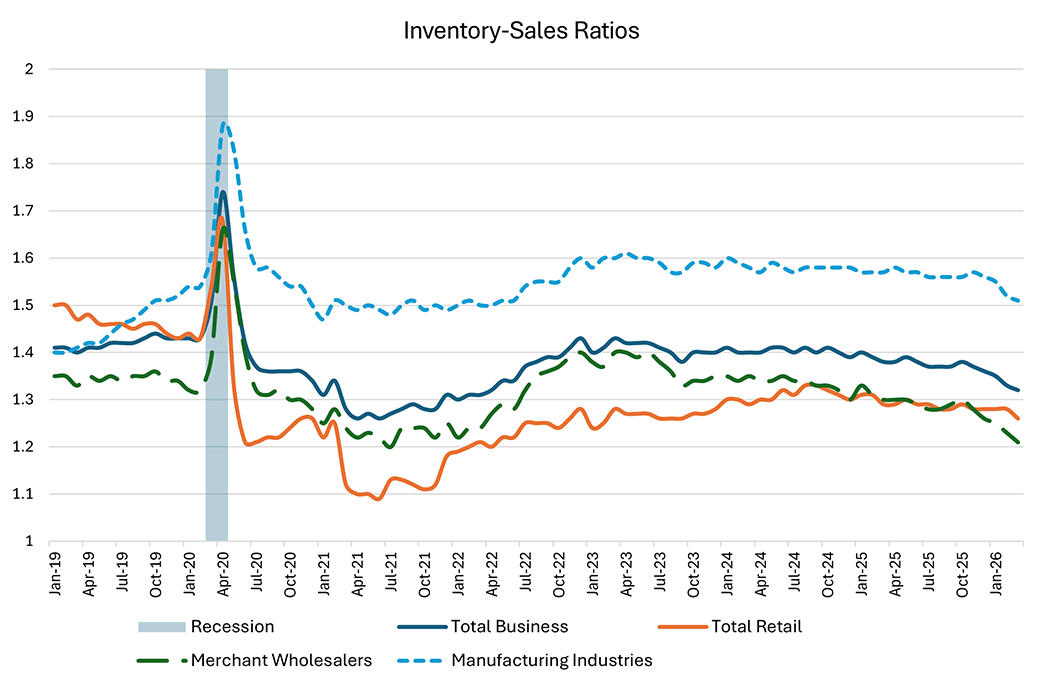
Businesses can cushion the impact of supply shocks by drawing down inventories. Figure 3 below shows that this has occurred for manufacturers, wholesalers, and retailers, with inventory-to-sales ratios declining over the six months leading up to March (the latest available reading). Except for retailers, these decreases predate the Iran war, but the conflict may nevertheless be exacerbating already-tight inventory conditions. An inventory cushion can allow businesses and their customers to ride out temporary cost shocks. However, if costs remain elevated, companies will eventually have to rebuild inventories at higher prices, which may entail passing more of the cost increase to customers.
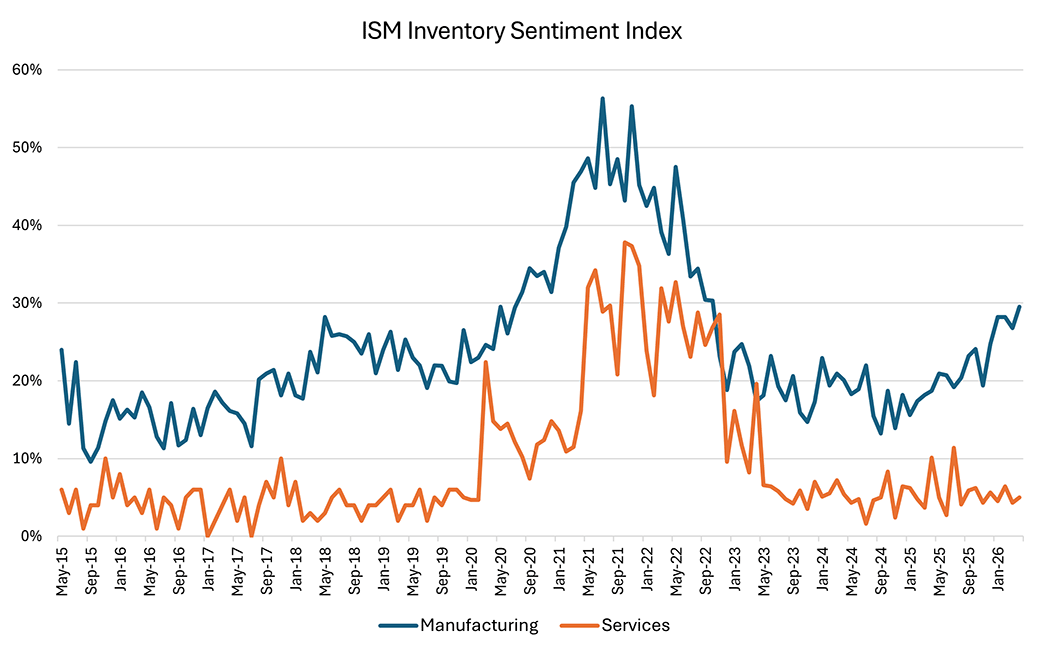
Does the recent deterioration in supply conditions mean we're headed toward the short-supply economy of 2022? Survey data from ISM suggest otherwise. Figure 4 below plots ISM's Inventory Sentiment Index, which measures the share of respondents who believe customer inventories are too low. Within the ISM services survey, a significant portion of respondents do not track customer inventories: In April's report, 30 percent said they do not have inventories or do not measure them. For the remaining share of respondents, their perception of customer inventories refers to material inputs, such as newsprint for a media company.
In 2021-2022, perceptions of tight supply conditions were shared across manufacturing and services businesses. In contrast, in the most recent data, an increasing share of manufacturing firms believes their customers are running inventory levels that are too low, but services businesses have not seen an increase in this measure. For now, these data suggest that inventory pressure is not broadly shared across all firms, which could mean the Iran war disruption to the economy will not be as severe as the 2022 supply shock.
Views expressed in this article are those of the author and not necessarily those of the Federal Reserve Bank of Richmond or the Federal Reserve System.
Contact Us