How Constrained Are Global Supply Chains?
Macro Minute
May 20, 2025
With global tariff and trade policies undergoing dramatic change, global supply chains may become stressed. In turn, this could create upside risk to the near-term inflation outlook. In this week's post, we look at two indexes of global supply chain frictions: the World Bank's Global Supply Chain Stress Index (GSCSI) and the Federal Reserve Bank of New York's Global Supply Chain Pressure Index (GSCPI). These measures are plotted in Figure 1, and both can be seen rising during the 2021-22 supply chain crisis.
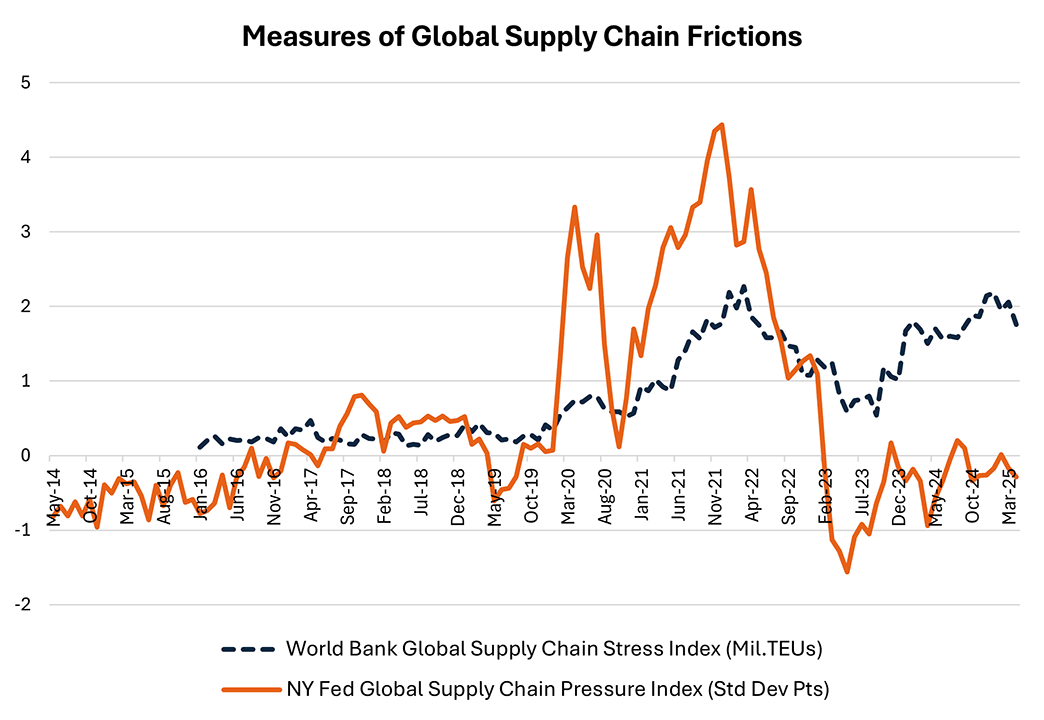
However, over the past year and a half, the two indexes have diverged. According to the GSCSI, global supply chain stress is currently at levels similar to those seen in 2021-22. In contrast, according to the GSCPI, global supply chain pressure is currently close to normal levels. Why are these two indexes so different, and what are they telling us about the state of global supply chains today?
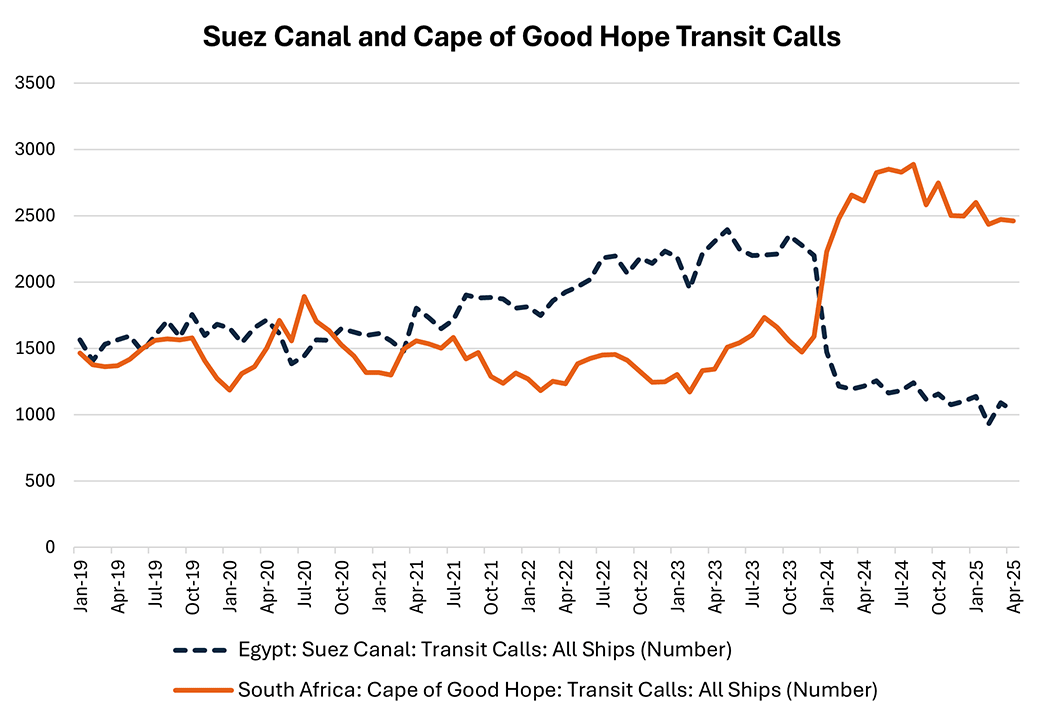
The GSCSI is a monthly measure of global maritime supply chain disruptions. It captures the volume of global shipping capacity that is delayed across global ports, based on port-level data on container shipping traffic flows. As shown in Figure 1, the GSCSI rose during the supply chain crisis, exacerbated by pandemic-related port closures in Asia combined with high demand for goods in the U.S. Subsequently, it began to rise again in late 2023 in response to the Red Sea crisis (during which Yemeni militants attacked merchant and naval vessels in the Red Sea) and has remained at high levels since then: Red Sea transit through the Suez Canal has not yet recovered, while transit through a longer alternate route around the Cape of Good Hope remains elevated (Figure 2).
The GSCPI is a monthly measure of global supply chain pressure, broadly defined. It is based on not only measures related to the container shipping industry, but also bulk shipping costs, airfreight and global manufacturing surveys of supply chain conditions (such as delivery times, inventories and order backlogs). The index is available monthly and expressed as a standard score (that is, the number of standard deviations from the mean), with higher readings indicating greater degrees of global supply chain pressure. As shown in Figure 1, the index rose during the supply chain crisis but has been below zero for most of the past two years, indicating lower-than-average levels of supply chain pressure.
Because the GSCSI has a narrower scope than the GSCPI (due to focusing on maritime containerized shipping), it does not capture conditions reflected in other shipping channels such as airfreight. Additionally, even within maritime supply chains, the GSCSI focuses on large container vessels. Because it excludes smaller ships, it may not fully capture all port stress across the entire shipping network. As a result, the GSCSI may be more affected than the GSCPI by shocks idiosyncratic to large-vessel container shipping, such as the Red Sea crisis.
For signaling short-run movements in inflation — which is the rise in the overall cost of living — a broader measure of supply chain pressure like the GSCPI is likely to be more useful. Recent readings of the GSCPI provide some reason for comfort, although the linkage between inflation and supply chain pressure isn't always tight: A spike in the GSCPI in 2020 did not lead to an inflation spike in that year. With further trade policy changes expected, this index may bear watching to assess how the economy evolves, as well as clues for how inflation might react.
Note: Macro Minute will go on break next week due to the Memorial Day holiday.
Views expressed in this article are those of the author and not necessarily those of the Federal Reserve Bank of Richmond or the Federal Reserve System.
Contact Us