A Tale of Two PCEs: Market- and Nonmarket-Based Prices
Macro Minute
February 3, 2026
Within the goods and services categories incorporated into the personal consumption expenditures (PCE) price index, there exists an important distinction between market-based prices and nonmarket-based prices. According to the Bureau of Economic Analysis, market-based prices are "based primarily on observed market transactions for which there are corresponding price measures." In contrast, nonmarket prices encompass categories where expenditures are imputed (such as financial services furnished without payment) or categories where prices are not collected from observed market transactions (such as most insurance purchases, gambling, margins on used light motor vehicles, and expenditures by U.S. residents abroad).
As shown in Figure 1 below, the bulk of total and core PCE is made up of market-based components, although the share has been decreasing.
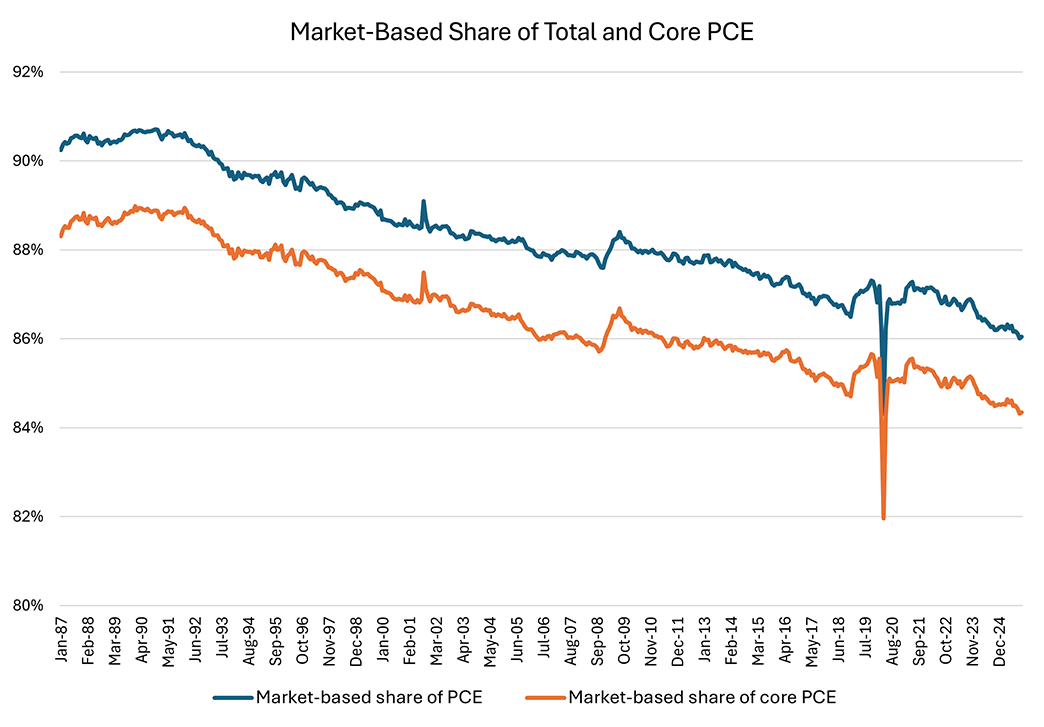
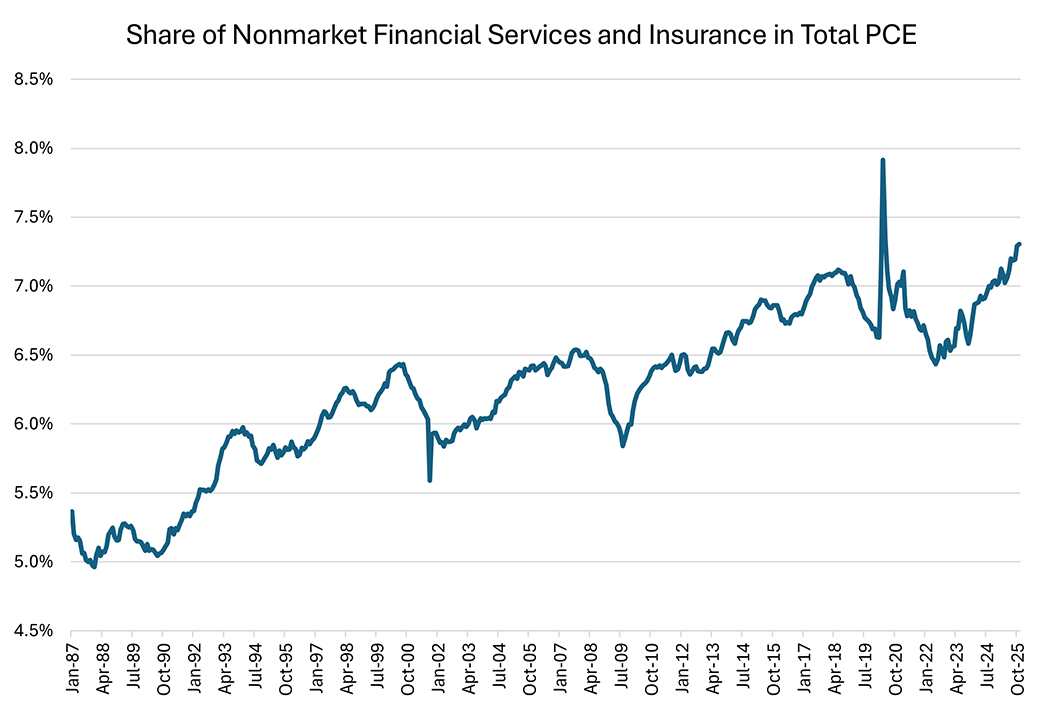
Figure 2 below shows that this is partly due to the increasing share of nonmarket financial services and insurance consumption (likely due to the aging of the population).
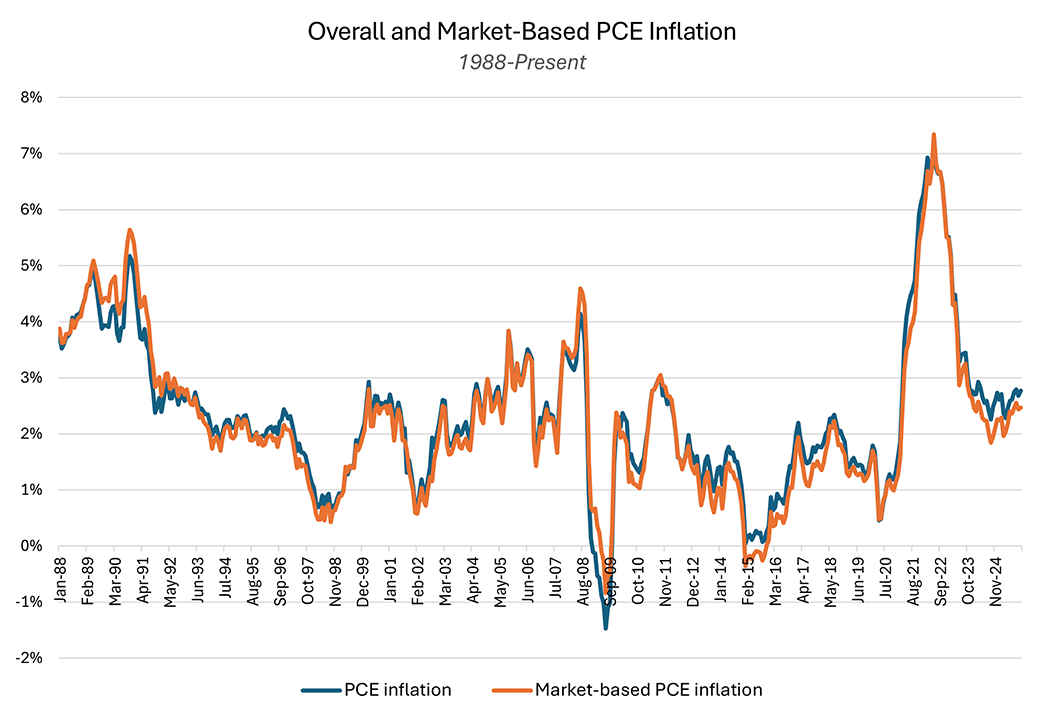
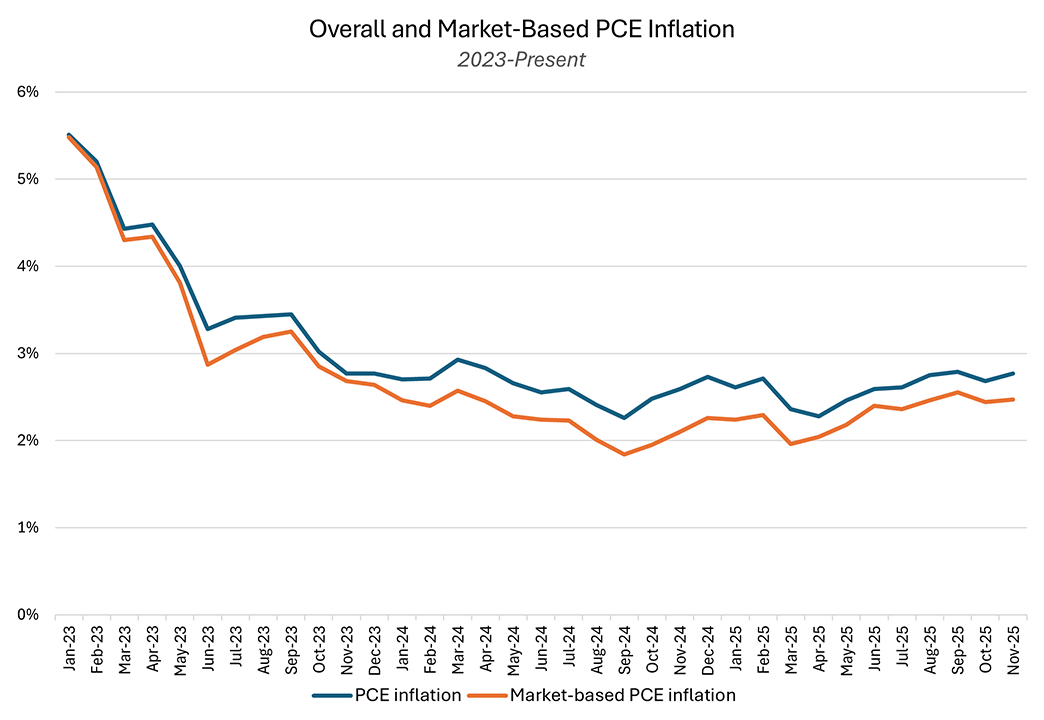
With the bulk of personal consumption expenditures being market-based, there is a close relationship between overall inflation and market-based PCE inflation, as seen in Figure 3a below. However, Figure 3b also shows that there are differences between both inflation metrics, which can affect assessments of how far current inflation is from its pre-pandemic benchmark. As of November, year-over-year PCE inflation was 2.8 percent, 100 basis points higher than its 1995-2019 average of 1.8 percent. In contrast, year-over-year market-based PCE inflation was 2.5 percent, 80 basis points above its 1995-2019 average of 1.7 percent.
In which spending categories do we see the largest differences between market-based and nonmarket-based price indexes? Table 1 below shows the latest (November) year-over-year changes in the standard and market-based price indexes of several spending categories. (Note that categories are weighted differently between the overall and market-based measures of inflation.) The largest disparity between the standard and the market-based price indexes is attributable to the financial services and insurance category.
| Category | PCE Inflation (%) | Market-Based PCE Inflation (%) |
|---|---|---|
| Financial Services & Insurance | 6.12 | 0.82 |
| Other Services | 3.56 | 3.29 |
| Motor Vehicles & Parts | 1.90 | 1.67 |
| Recreation Services | 2.48 | 2.38 |
| Other Nondurables | 1.97 | 1.88 |
| Food Services & Accommodations | 2.51 | 2.47 |
| Clothing & Footwear | -0.44 | -0.44 |
| Gasoline & Other Energy Goods | 1.52 | 1.52 |
| Household Utilities | 6.41 | 6.41 |
| Health Care | 2.82 | 2.82 |
| Transportation Services | 3.33 | 3.33 |
| Food & Energy | 2.63 | 2.63 |
| Food & Bev Purch for Off-Premises Consumption | 1.92 | 1.92 |
| Source: Bureau of Economic Analysis via Haver Analytics | ||
The market-based PCE price index bears watching as part of the constellation of data informing assessments of inflation pressure. Research by Cleveland Fed economists finds that market-based PCE inflation has a strong association with labor market conditions and that market-based PCE inflation is better at predicting near-term PCE inflation compared to headline and median PCE inflation. Given the latter finding, it's possible that we've made a bit more progress toward the Fed's 2 percent target than the latest headline inflation reading currently predicts.
Views expressed in this article are those of the author and not necessarily those of the Federal Reserve Bank of Richmond or the Federal Reserve System.
Contact Us