How Does the Foreign-Born Population Affect Labor Force Growth?
Economic Brief
January 2026, No. 26-03
Key Takeaways
- Long-term demographic trends, especially population aging, have been a major factor contributing to the slowdown in labor force growth. Once age composition is considered, a large part of the apparent decline in participation among native workers reflects shifting age structure rather than changes in actual labor force participation rates.
- Foreign-born workers have provided a steady positive contribution to labor force growth. Their role has grown mainly because of population expansion through net migration, although they too show signs of an aging profile over time.
- These patterns suggest that future labor force growth will rely more on population dynamics (aging and changes in the foreign-born population) rather than changes in participation.
Understanding the sources of U.S. labor force growth is increasingly important in light of slowing population growth, ongoing population aging and labor market adjustments following the COVID-19 pandemic. These demographic and economic shifts have implications for employers, policymakers and communities that rely on a stable and reliable workforce. To explore what drives the growth of the U.S. labor force, I break down the annual growth rate into different contributing factors, focusing on the different contributions of the native and foreign-born populations.
I proceed in two steps. First, I provide a broad overview of two primary drivers of labor force growth:
- Population growth, or the contribution from the increase in the number of individuals ages 16 and older
- Changes in labor force participation rates (LFPRs), or the percentage of the population that is working or actively looking for work
Second, I perform a more granular analysis that accounts for demographic changes across age groups.
The approach uses average annual data from the Bureau of Labor Statistics' Current Population Survey (CPS). The CPS is the primary source for U.S. labor market statistics and provides consistent and nationally representative information on the civilian noninstitutional population. These data offer a long historical series and detailed breakdowns by nativity, age and gender, which is essential for separating demographic shifts from changes in participation.1
While the analysis presented here is descriptive and based on aggregate data, it attempts to clarify the broad forces shaping the labor supply. By separating population changes from shifts in labor force participation patterns, we can make better sense of recent trends and what they may imply for the longer term.
Overall Drivers of Labor Force Growth
Over the period 2006-24, the U.S. labor force increased at an average annual rate of 0.62 percent. This growth was driven by population growth rather than by changes in labor force participation. While total adult population growth contributed about 0.91 percentage points on average to annual growth, changes in participation acted as a drag, reducing growth by about 0.29pp annually.
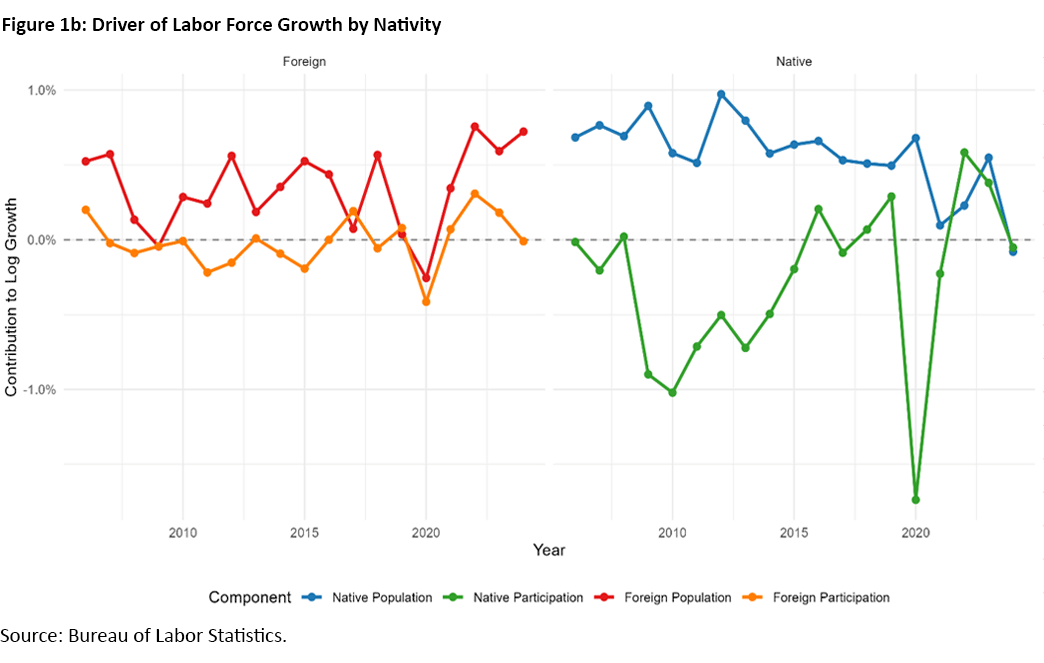
Native and foreign-born workers contribute to labor force growth through different channels. To assess their relative importance, I decompose and quantify overall growth into four components:
- Native population
- Native participation
- Foreign-born population
- Foreign-born participation
Figure 1 illustrates this decomposition. Each bar represents the contribution of a specific component of the annual labor force (represented by the black line). The height of the bar shows how much that component added to (positive) or subtracted from (negative) the total growth rate.
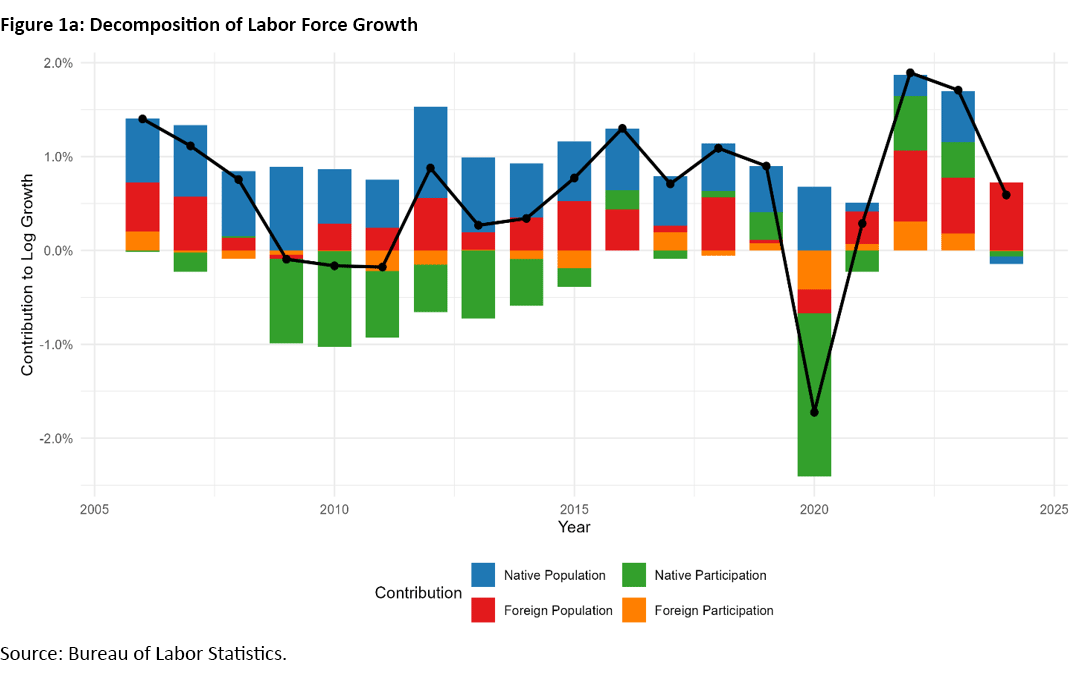
Each contribution is determined by two elements:
- The group's share of the total labor force
- The rate at which that factor is changing (whether through population growth or changes in participation, in this case)
The contribution is simply the product of these two numbers: the group's labor force share multiplied by the rate of change of the respective factor.2 For example, consider the native population (blue bars). Since native workers constitute a large proportion of the labor force, even a small percentage increase in their population generates a substantial positive contribution to overall growth.
The graphs show that, during the period under analysis, the foreign-born population (at about 0.33pp per year) contributed slightly more to overall labor force growth than the native population (about 0.29pp). Among native individuals, population growth accounted for roughly 0.57pp annually. However, declining (average) participation rates offset part of this increase, contributing about -0.28pp. Looking ahead, the native population faces not only a continued weakness in participation, but also a slowing population growth.
By contrast, the foreign-born population has positively contributed to labor force growth, driven largely by demographic expansion. For this group, the population and participation components contributed approximately 0.35pp and -0.01pp per year, respectively. In 2024, for instance, nearly all the observed labor force growth was sustained by the foreign-born population component.
This simple approach offers a broad sense of whether labor force growth is driven mainly by population changes or by shifts in participation. However, because it relies on aggregate participation rates, the approach does capture differences across age groups. As the population ages, the overall participation rate may decline even if participation within each age group is stable. A more detailed decomposition by age helps shed light on these demographic changes.
Accounting for Age Composition
To distinguish these drivers, I perform a more detailed decomposition that accounts for age by further decomposing the labor force participation component into pure participation changes and demographic shifts (such as those arising from an aging population). Age is a major determinant of labor force activity, since people in their prime working years participate at much higher rates than those in traditional retirement ages.
I divide the population into specific age groups (16-24, 25-34, 35-44, 45-54, 55-64 and 65+) and evaluate the contribution of changes in the age composition of the native and foreign-born populations. This age component accounts for the impact of the population shifting between age groups.
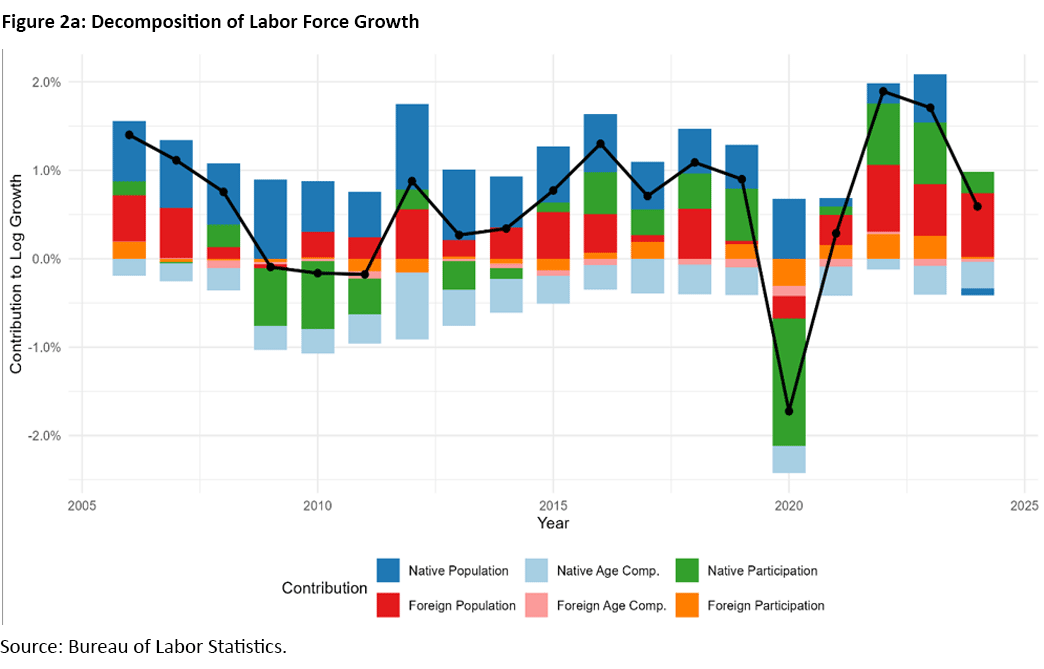
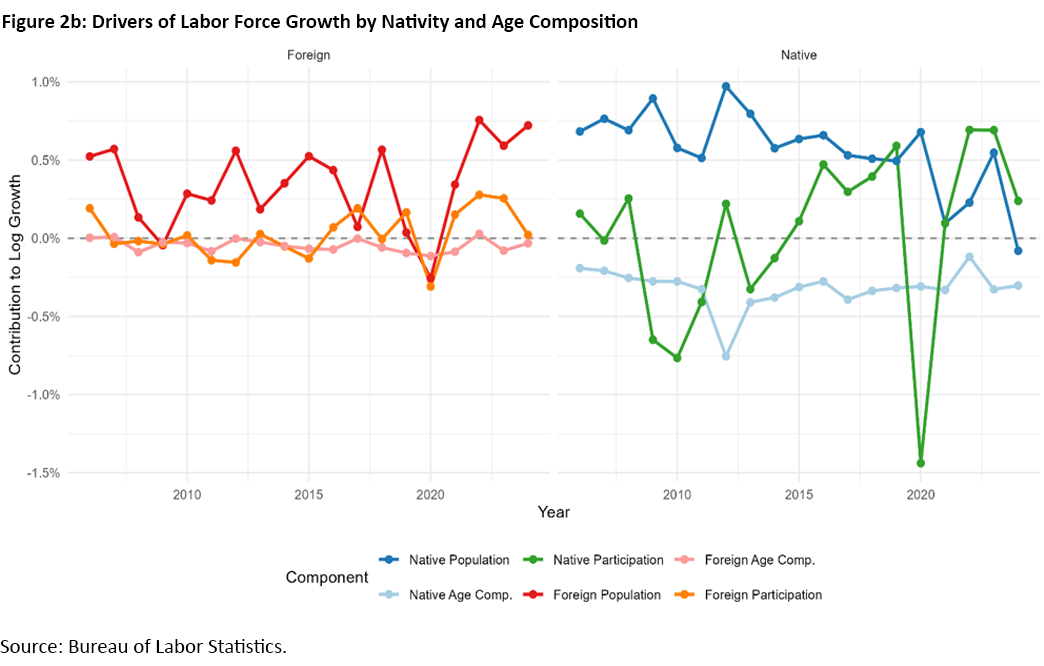
In the simple decomposition, native participation appears to be a major drag on labor force growth (-0.28pp per year). When we account for age composition, we see that the decline in the aggregate native LFPR is driven almost entirely by age composition (-0.32pp per year). This means that the shift of the native population into older age groups — which generally have lower labor force participation — reduces total growth by nearly one-third of a percentage point every year. Note that native participation actually contributes 0.03pp (on average) per year.
In sum, the more detailed decomposition highlights that demographic aging is a significant drag on the native contribution. The foreign-born contribution remains robust primarily due to population inflows, although it also undergoes demographic shifts (population aging).
Period Comparison: Pre-COVID vs. Full Period
Comparing the prepandemic years (2006-19) to the full sample period (2006-24) shows that the trends are stable, with some minor differences:
- The total labor force growth rate is lower in the full sample (0.62 percent) versus the prepandemic period (0.65 percent).
- The contribution of the native population component is also lower in the full sample (0.57pp) versus the prepandemic sample (0.66pp).
- The contribution of the foreign population component is larger in the full sample (0.35pp) versus the prepandemic sample (0.32pp), thus becoming relatively more important.
- The negative impact of shifts in the native age composition is large during both periods (-0.34pp in the prepandemic sample and -0.32pp in the full sample), indicating this is a long-term structural trend, not just a short-term fluctuation.
- Overall, demographic shifts (population aging) subtract about 0.38pp from annual labor force growth, a magnitude observed both during the prepandemic years and in the full sample.
| Method | Component | 2006-19 | 2006-24 | ||||
|---|---|---|---|---|---|---|---|
| Foreign | Native | Total | Foreign | Native | Total | ||
| Nativity Only | Population | 0.32 | 0.66 | 0.98 | 0.35 | 0.57 | 0.91 |
| Participation | -0.03 | -0.31 | -0.33 | -0.01 | -0.28 | -0.29 | |
| Total | 0.29 | 0.36 | 0.65 | 0.33 | 0.29 | 0.62 | |
| Age-Adjusted | Population | 0.32 | 0.66 | 0.98 | 0.35 | 0.57 | 0.91 |
| Participation | 0.01 | 0.01 | 0.02 | 0.03 | 0.03 | 0.05 | |
| Age Composition | -0.04 | -0.34 | -0.38 | -0.05 | -0.32 | -0.37 | |
| Total | 0.28 | 0.34 | 0.62 | 0.33 | 0.27 | 0.60 | |
| Note: Averages are calculated from BLS annual averages data. Totals may not sum exactly due to rounding. Also, the totals across methods may not coincide since they are approximations. (Residuals include all second-order and third-order interaction terms.) | |||||||
Changes in Demographic Composition
Given the importance of the demographic shifts highlighted above, it is useful to look more closely at the factors driving these patterns.
Age Composition Analysis
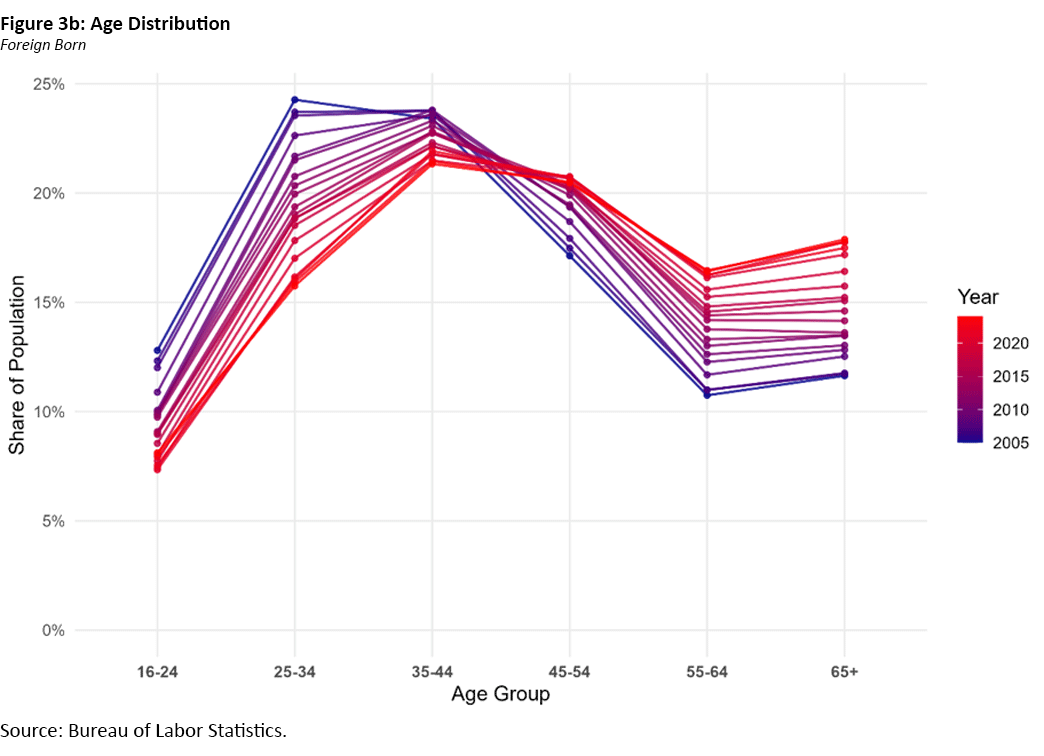
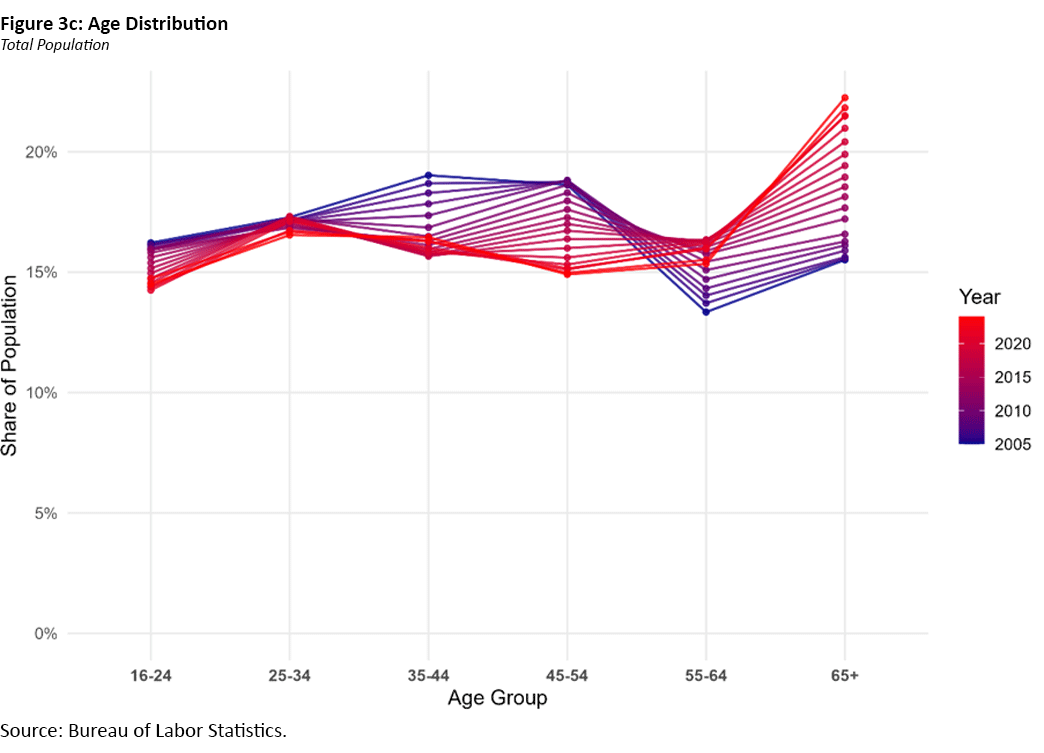
I begin by examining changes in the age structure of the native and foreign-born population. Figure 3 overlays yearly age distributions to visualize how the age distribution has shifted from 2005 to 2024.
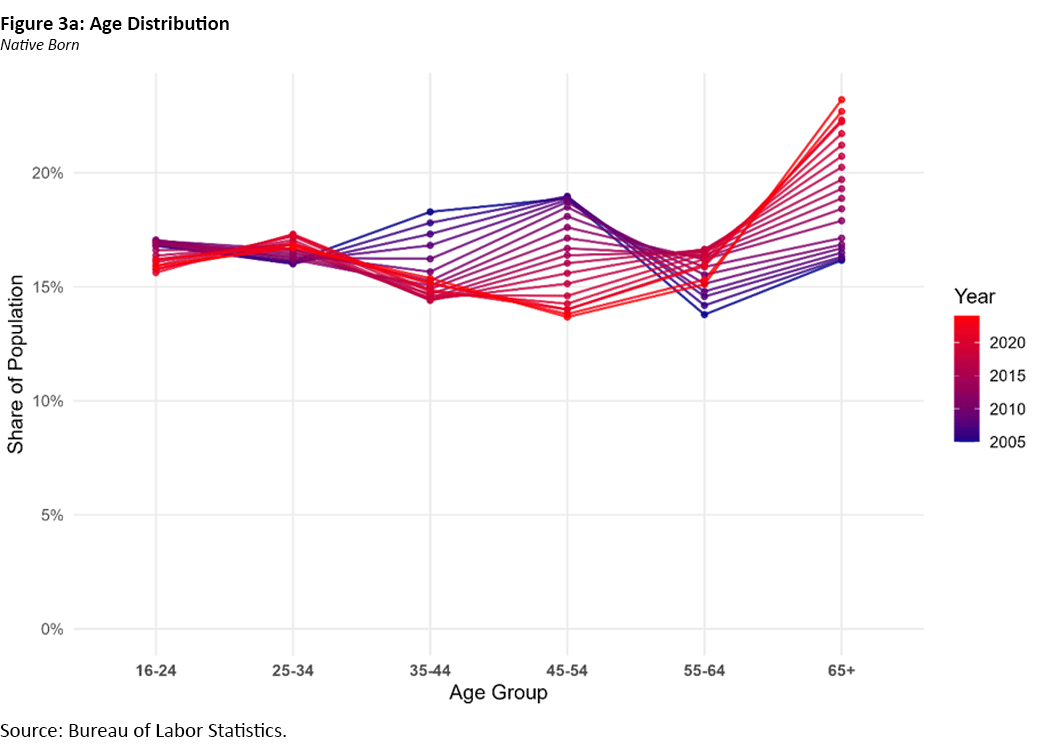
The figures reveal some interesting patterns. First, the native population has a clear aging pattern. The share of individuals 65 and older has grown substantially from about 16 percent in 2006 to more than 23 percent in 2024. A big part of this is due to baby boomers retiring. At the same time, the share of the prime working-age population — particularly those between 35 and 54 — has been slowly shrinking. This points to a gradual weaking of the core native labor supply.
Second, although the foreign-born population tends to be younger than the native population, it is getting older as well. The share of individuals between 16 and 34 has declined notably over the period, with the 25-34 group falling from nearly 24 percent to about 16 percent. At the same time, the distribution has shifted toward the 45-64 age range. This pattern suggests that the existing foreign-born population has been aging in place and that inflows of younger immigrants have not kept pace with earlier periods.
In sum, these trends point to a population structure that is shifting toward older age brackets. The overall share of individuals in the 35-54 age range has declined, while the 65-and-older group is the only age group showing steady growth. This shift likely implies a shrinking core labor pool and a diminishing demographic contribution to labor force growth.
Labor Force Participation Rates by Nativity
According to Table 1, the age composition effect is the dominant negative driver, outweighing participation effects. However, labor force participation patterns by age and nativity show some interesting changes over the period 2006-24 that are worth discussing.
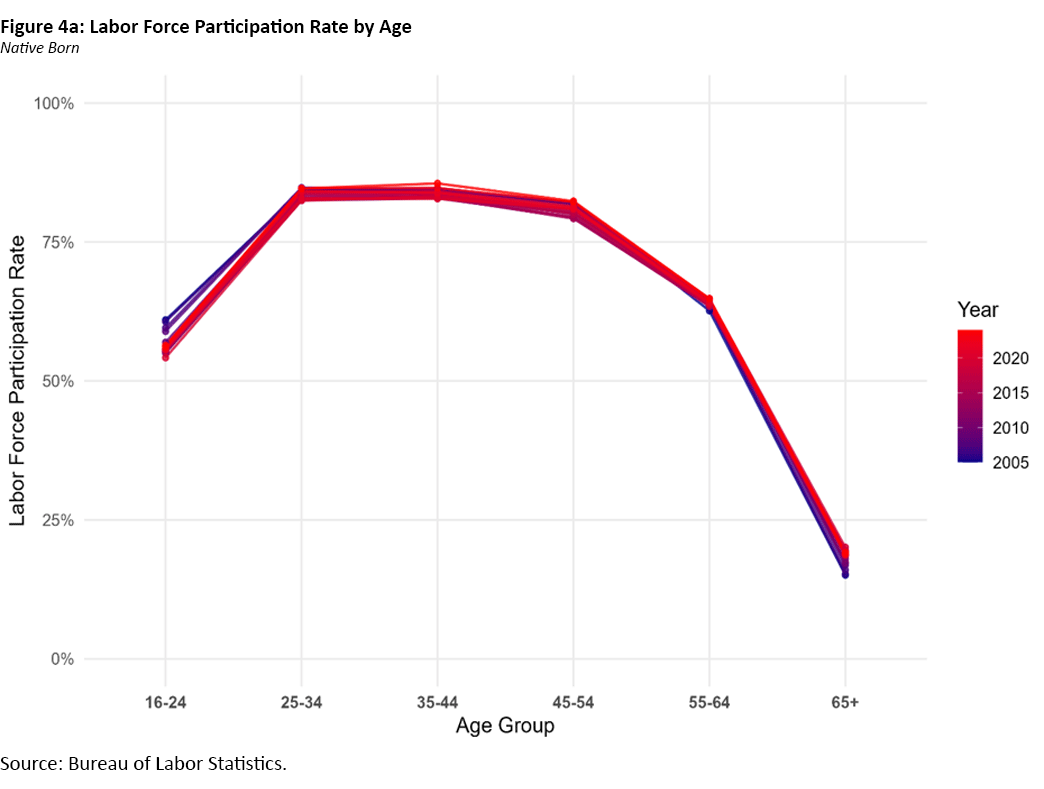

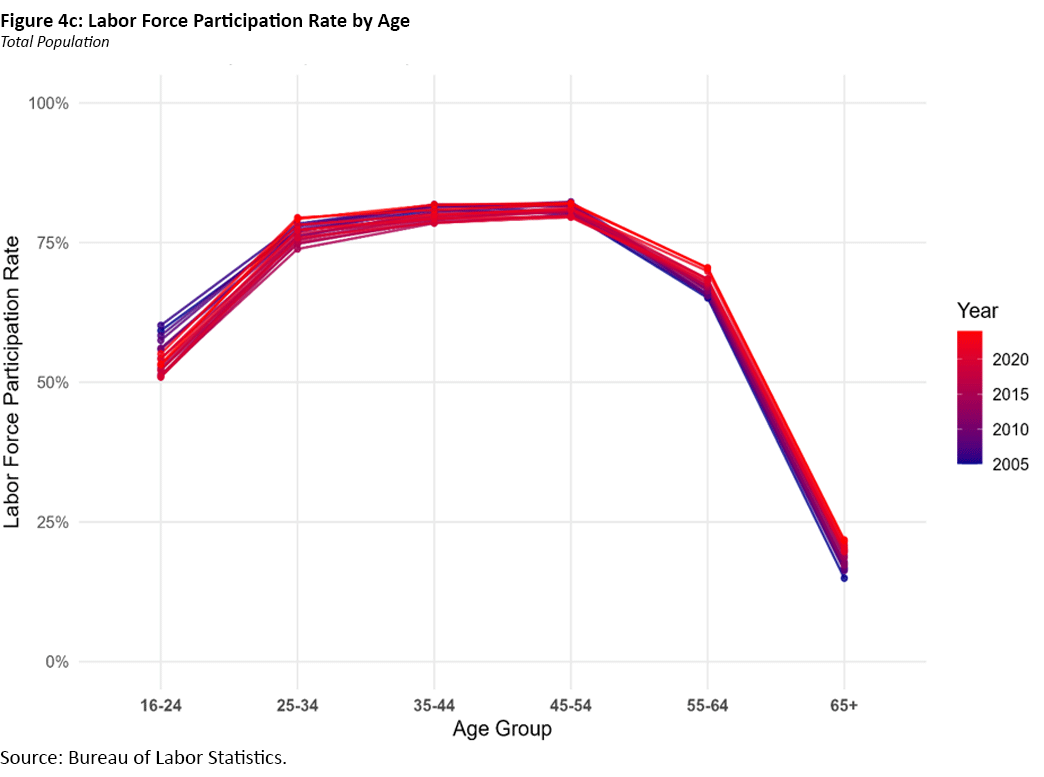
For the native population, the most relevant change is the decline in labor force participation for the 16-24 age group. Participation for this group dropped by about 5pp between 2005 and 2024. Conversely, older native individuals (ages 55+) exhibited a strong upward increase in participation. Prime-age native workers (25-54) have remained remarkably stable.
The foreign-born population shows a slightly different trend, characterized by higher participation in the older age brackets. Notably, foreign-born participation in the 55-64 and 65+ age groups rose by 5pp and 7pp, respectively, from 2005 to 2024.
Labor Force Participation by Nativity and Gender
Finally, I compare the behavior of the LFPR by both nativity and gender. Specifically, I track changes in the LFPR during the full sample across four groups: native men, native women, foreign-born men and foreign-born women.
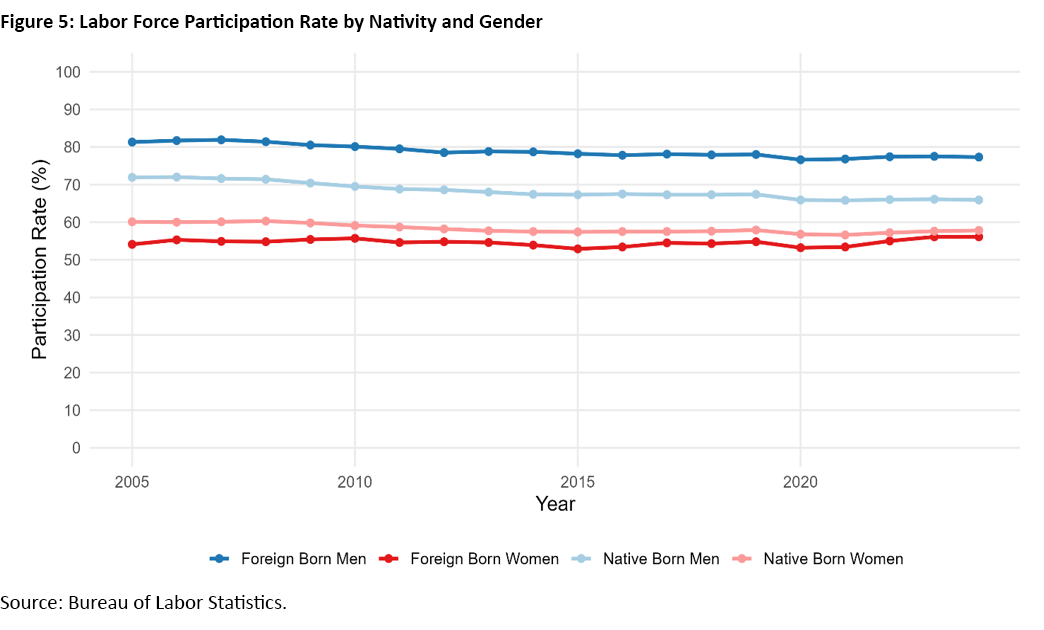
Foreign-born men consistently show the highest labor force participation, outpacing native men by about 9pp in 2005 and widening the gap to over 11pp by 2024. On the other extreme, foreign-born women traditionally have the lowest LFPRs. In 2024, the breakdown of labor force participation by each group is:
- Foreign-born men: 77.3 percent
- Native men: 65.9 percent
- Native women: 57.8 percent
- Foreign-born women: 56.1 percent
It is worth emphasizing, though, that native men experience the steepest long-term decline, with their LFPR falling from 71.9 percent in 2005 to 65.9 percent in 2024.
While foreign-born women have the lowest labor force participation over the full sample, they are the only group showing an upward trend in recent years. Their participation reached 56.1 percent in 2023-24, recovering beyond prepandemic levels and considerably narrowing their gap with native women.
All groups experienced a decline during the 2020 COVID-19 recession, but recovery since then has been uneven. In the postpandemic period, foreign-born women exceeded their 2019 rates, while both male groups and native women largely stabilized at or slightly below their prepandemic baselines.
Conclusion
The descriptive analysis performed in this article highlights how demographic forces have affected labor force growth over the past two decades. A major factor behind the slowing contribution from the native population is the aging of the large baby boomer generation. As more individuals from this cohort move into older age groups, overall labor force participation mechanically declines. Still, when we look within specific age groups, LFPRs among native individuals have remained relatively stable.
At the same time, the foreign-born population has played a positive role in supporting labor force growth, primarily due to increases in population size. These inflows have helped offset the demographic drag from the aging native population. However, the foreign-born population is also aging, and the share of younger foreign-born has declined relative to earlier periods.
It's worth noting that this analysis is based on aggregate CPS data and is intended to capture broad population-level patterns rather than explain specific causes or individual behavior. Nonetheless, the trends suggest that demographic structure is playing an increasingly central role in shaping the labor force. As aging continues, migration and population growth will likely remain key drivers in sustaining the domestic labor market.
Santiago Pinto is a senior economist and policy advisor in the Research Department at the Federal Reserve Bank of Richmond.
1
Although the CPS is useful for tracking national patterns, other datasets may be needed for more detailed analysis. The Census Bureau's American Community Survey, for example, has a much larger sample and is better for examining state-level variation or specific immigrant subgroups, though it is available with a longer delay. CPS microdata (such as those provided through IPUMS) would allow for more detailed cross-tabulations, including variables like education or household structure. This kind of analysis, however, goes beyond what is possible with the preaggregated series used in this analysis.
2
The decomposition is essentially a weighted average of each factor across demographic groups, where the weights are each group's share of the labor force.
To cite this Economic Brief, please use the following format: Pinto, Santiago. (January 2026) "How Does the Foreign-Born Population Affect Labor Force Growth?" Federal Reserve Bank of Richmond Economic Brief, No. 26-03.
This article may be photocopied or reprinted in its entirety. Please credit the author, source, and the Federal Reserve Bank of Richmond and include the italicized statement below.
Views expressed in this article are those of the author and not necessarily those of the Federal Reserve Bank of Richmond or the Federal Reserve System.
Subscribe to Economic Brief
Receive a notification when Economic Brief is posted online.
Contact Us