Business Cycles: Is the Current Economic Environment Different?
Economic Brief
February 2026, No. 26-07
Additional Resources
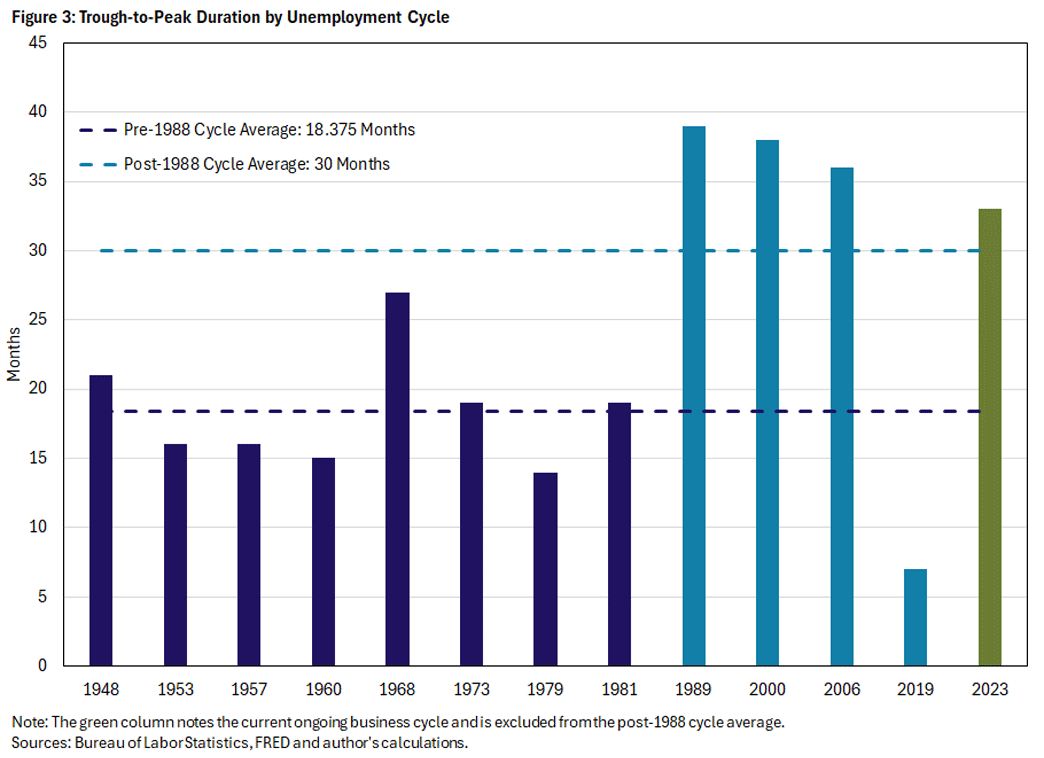
- Post-1988 unemployment cycles are significantly longer than earlier ones: 18.4 months for pre-1988 cycles, and 30 months for post-1988.
- The current cycle has been especially gradual, with unemployment rising steadily for 33 months — the longest on record without a recession following.
- In particular, the current cycle is atypical in that the sustained increase in unemployment occurs while GDP growth is, instead, strongly positive.
The U.S. economy has been sending mixed signals for nearly three years. Unemployment rose from 3.4 percent in April 2023 to 4.4 percent in December 2025, which is a remarkably slow pace by historical standards for such an increase. GDP growth has remained positive in most quarters, albeit at subdued levels. Are we witnessing the early stages of a recession? To answer this question, we must first understand how economists measure and date business cycles and examine how the current episode compares to historical precedent.
The Anatomy of a Business Cycle
A business cycle refers to the fluctuations in aggregate economic activity that occur over time. The classic framework — codified by Arthur Burns and Wesley Mitchell in their seminal 1946 work Measuring Business Cycles — identifies two primary phases: expansions and recessions.
These phases are bounded by peaks marking the end of expansions (and, thus, the beginning of recessions) and troughs marking the end of recessions (and, thus, the beginning of expansions).
Importantly, business cycles are not defined by a single indicator, such as the popular misconception that two consecutive quarters of negative GDP growth constitutes a recession. Rather, recessions involve broad-based declines across multiple dimensions of economic activity, including output, employment, income and sales.
How Recessions Are Dated
In the U.S., the National Bureau of Economic Research (NBER) Business Cycle Dating Committee serves as the official arbiter of recession dates. The NBER's definition of a recession emphasizes that "a recession involves a significant decline in economic activity that is spread across the economy and lasts more than a few months." Three criteria guide the committee's determination:
- Depth, or how severe the decline is
- Diffusion, or how broadly spread it is
- Duration, or how long it lasts
The committee emphasizes that extreme conditions in one dimension may partially offset weaker indications in another.
The NBER examines several monthly indicators, with particular emphasis on real personal income less transfers, nonfarm payroll employment, real personal consumption expenditures and industrial production. While highly visible, the unemployment rate receives less weight because it is a lagging indicator that often continues rising after a recession has ended. For instance, following the June 2009 trough of the Great Recession, unemployment continued to rise for four months, peaking at 10 percent in October 2009.
Peaks, Troughs and the Unemployment Rate
For analyzing labor market dynamics, it is useful to examine peaks and troughs in the unemployment rate itself, rather than in overall economic activity. An unemployment trough represents the point at which the jobless rate reaches its cyclical low before trending upward. An unemployment peak represents the point at which joblessness reaches its cyclical high before trending downward. The interval from trough to peak captures the period during which labor market conditions are deteriorating.
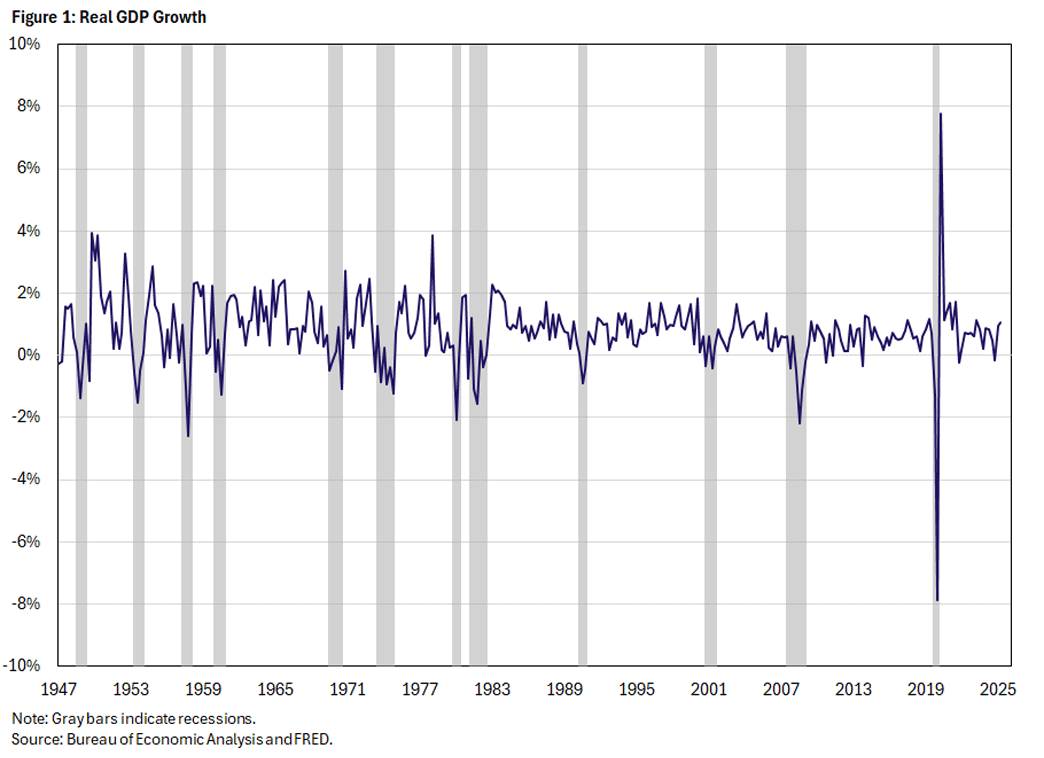
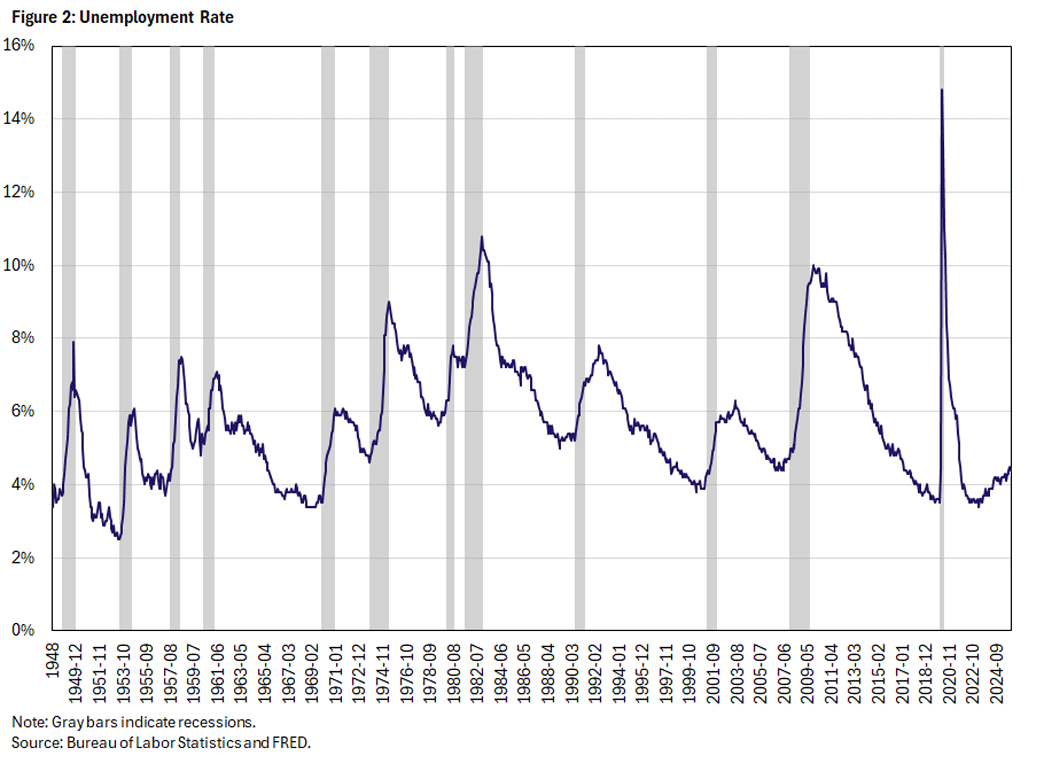
Figures 1 and 2 display the unemployment rate and real GDP growth, respectively, from 1948 to 2025, with NBER recession periods shaded. The visual relationship between these series is immediately apparent: Unemployment rises sharply during recessions and falls gradually during expansions. However, the lag between GDP contractions and unemployment peaks is also evident, underscoring why employment is considered a lagging indicator.
Historical Patterns in Trough-to-Peak Duration
Table 1 presents the 12 completed unemployment cycles since 1948, plus the current ongoing cycle. Several patterns emerge. First, there is substantial variation in cycle duration, ranging from just seven months (the COVID shock of 2020) to 39 months (the 1989-92 cycle). Second, there is a notable structural break around 1988: Pre-1988 cycles averaged 18.4 months from trough to peak, while post-1988 cycles averaged 30.0 months (or 37.7 months excluding the COVID outlier).
| # | Trough | Rate | Peak | Rate | Months |
|---|---|---|---|---|---|
| 1 | 1948-01 | 3.4% | 1949-10 | 7.9% | 21 |
| 2 | 1953-05 | 2.5% | 1954-09 | 6.1% | 16 |
| 3 | 1957-03 | 3.7% | 1958-07 | 7.5% | 16 |
| 4 | 1960-02 | 4.8% | 1961-05 | 7.1% | 15 |
| 5 | 1968-09 | 3.4% | 1970-12 | 6.1% | 27 |
| 6 | 1973-10 | 4.6% | 1975-05 | 9.0% | 19 |
| 7 | 1979-05 | 5.6% | 1980-07 | 7.8% | 14 |
| 8 | 1981-04 | 7.2% | 1982-11 | 10.8% | 19 |
| 9 | 1989-03 | 5.0% | 1992-06 | 7.8% | 39 |
| 10 | 2000-04 | 3.8% | 2003-06 | 6.3% | 38 |
| 11 | 2006-10 | 4.4% | 2009-10 | 10.0% | 36 |
| 12 | 2019-09 | 3.5% | 2020-04 | 14.8% | 7 |
| 13 | 2023-04 | 3.4% | Ongoing | 4.4% | 33 |
| Sources: Bureau of Labor Statistics and author's calculations. | |||||
This lengthening of cycles has been attributed to several factors, including the decline of manufacturing employment, the rise of the service economy, changes in labor market institutions and shifts in monetary policy frameworks. Whatever the cause, the implication for forecasters is clear: Post-1988 labor market deteriorations have tended to be slower and more prolonged than their predecessors.
The Current Cycle: Unprecedented Gradualism
The current cycle — which began with the April 2023 unemployment trough of 3.4 percent — stands out for its exceptional gradualism. In the 33 months since its trough, unemployment has risen by just 1 percentage point to 4.4 percent, a 29 percent increase. By comparison, the three most recent completed cycles saw unemployment rise by 2 to 5.1 percentage points from their trough after 33 months, representing increases of 46 percent to 116 percent.
| Cycle | Trough | Rate @ 33 mo | ∆ (pp) | ∆ (%) |
|---|---|---|---|---|
| 1990-91 Recession | 5.0% | 7.3% | +2.3 | +46% |
| 2001 Recession | 3.8% | 5.8% | +2.0 | +53% |
| Great Recession | 4.4% | 9.5% | +5.1 | +116% |
| Current (2023-?) | 3.4% | 4.4% | +1.0 | +29% |
Perhaps most striking is the duration for which unemployment has been rising while remaining below 4.5 percent. This period now extends to 29 months, the longest such episode in the post-World War II era. Historically, every prior episode of unemployment rising from a low base while still under 4.5 percent was followed by a recession. The current episode is unprecedented in its gradualism.
The GDP data tell a similar story. Since the first quarter of 2022, quarterly real GDP growth has averaged just 0.59 percent, with 13 of 15 quarters registering growth of less than 1 percent and the other two quarters experiencing outright contraction (the first quarter of 2022 at -0.25 percent and the first quarter of 2025 at -0.16 percent). This pattern of persistent but shallow weakness is distinct from the sharp contractions that characterized earlier downturns.
Related Listening
In the May 6, 2026 episode of the Speaking of the Economy podcast, Claudia Macaluso explains how economists identify the points of expansion and contraction in the national economy and how the current business cycle differs from past cycles.
Implications and Outlook
The data present a genuine puzzle. On one hand, the historical record suggests that sustained labor market deterioration from a low base has always presaged recession. On the other hand, the exceptional gradualism of the current episode, the resilience of GDP and the unusual macroeconomic backdrop — including the postpandemic recovery, aggressive monetary tightening and changed international trade environment — make direct historical comparison less straightforward.
Two interpretations are possible. The first is that we are witnessing a successful soft landing, in which the Federal Reserve's tightening cycle has cooled labor market conditions without triggering a recession. The second is that we are in the early stages of a slow-motion downturn and that the post-1988 pattern of prolonged cycles means the recession has simply not yet materialized.
What is clear is that the current episode does not fit neatly into historical templates. With unemployment at 4.4 percent and GDP growth positive, the economy remains far from the distress associated with past recessions. Yet the persistent upward drift in joblessness (now extending 33 months) warrants continued vigilance. As always with business cycles, the definitive dating will come only in retrospect.
Claudia Macaluso is a senior research economist in the Research Department at the Federal Reserve Bank of Richmond.
To cite this Economic Brief, please use the following format: Macaluso, Claudia. (February 2026) "Business Cycles: Is the Current Economic Environment Different?" Federal Reserve Bank of Richmond Economic Brief, No. 26-07.
This article may be photocopied or reprinted in its entirety. Please credit the author, source, and the Federal Reserve Bank of Richmond and include the italicized statement below.
Views expressed in this article are those of the author and not necessarily those of the Federal Reserve Bank of Richmond or the Federal Reserve System.
Subscribe to Economic Brief
Receive a notification when Economic Brief is posted online.
Contact Us