What Is Trend Inflation?
Economic Brief
April 2026, No. 26-11
Key Takeaways
- I discuss three models of trend inflation that deliver strikingly different estimates of the trend.
- I argue that the concept of trend inflation is largely model and context dependent.
- Current estimates of trend inflation show no clear pattern about price pressures.
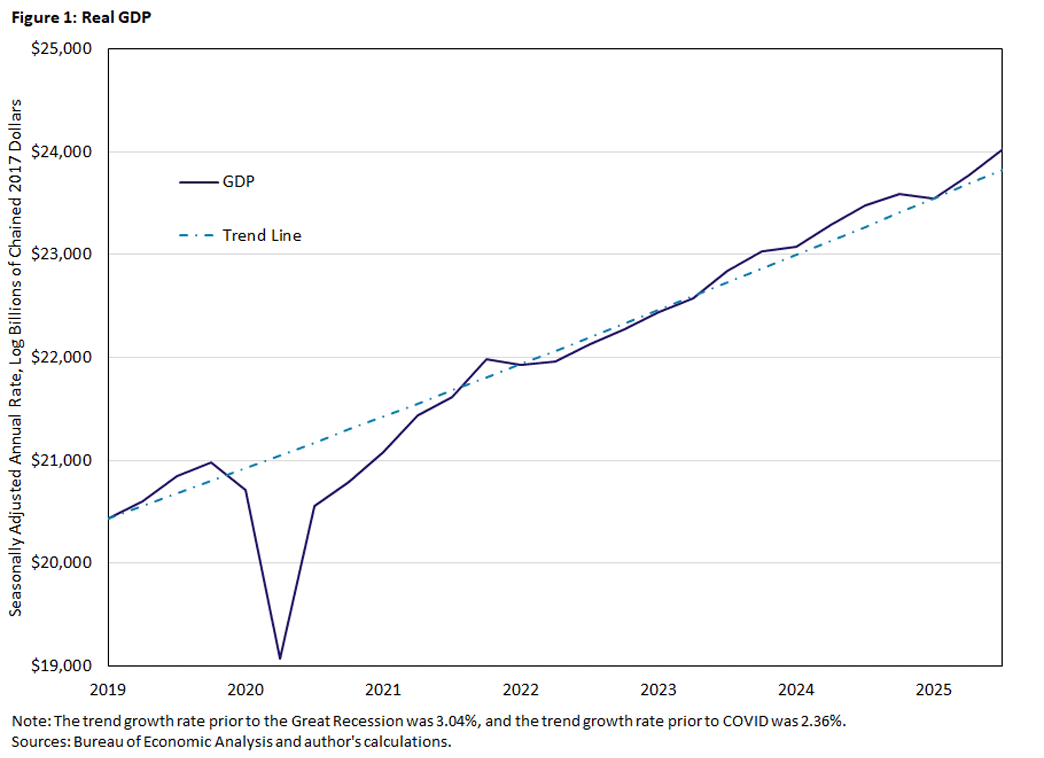
Key macroeconomic aggregates such as GDP or the labor force exhibit clear visible trends. That is, they increase or decrease in a persistent and steady manner over extended periods of time. In common parlance, a trend is thus a feature of economic growth that often makes outcomes seemingly predictable, as often referenced in the phrase "the trend is your friend" in forecasting or in stock market analysis.
A typical example is the trend in real GDP. Figure 1 shows the level of real GDP1 over the last six years and its estimated trend, which clearly follows a steady upward path. The estimated trendline is based on a simple linear regression. Large shocks to GDP, as in the pandemic, lead to substantial deviations from the preshock trend but can revert to the original trend path, as seen in the recovery from the pandemic.
Yet the term "trend" often appears attached to the word "inflation" in policy discussions. While inflation shows a remarkable degree of variability, it almost never shows the trend-like behavior seen in other macroeconomic variables such as GDP (outside of hyperinflationary episodes). So, what is this trend in inflation, or trend inflation?
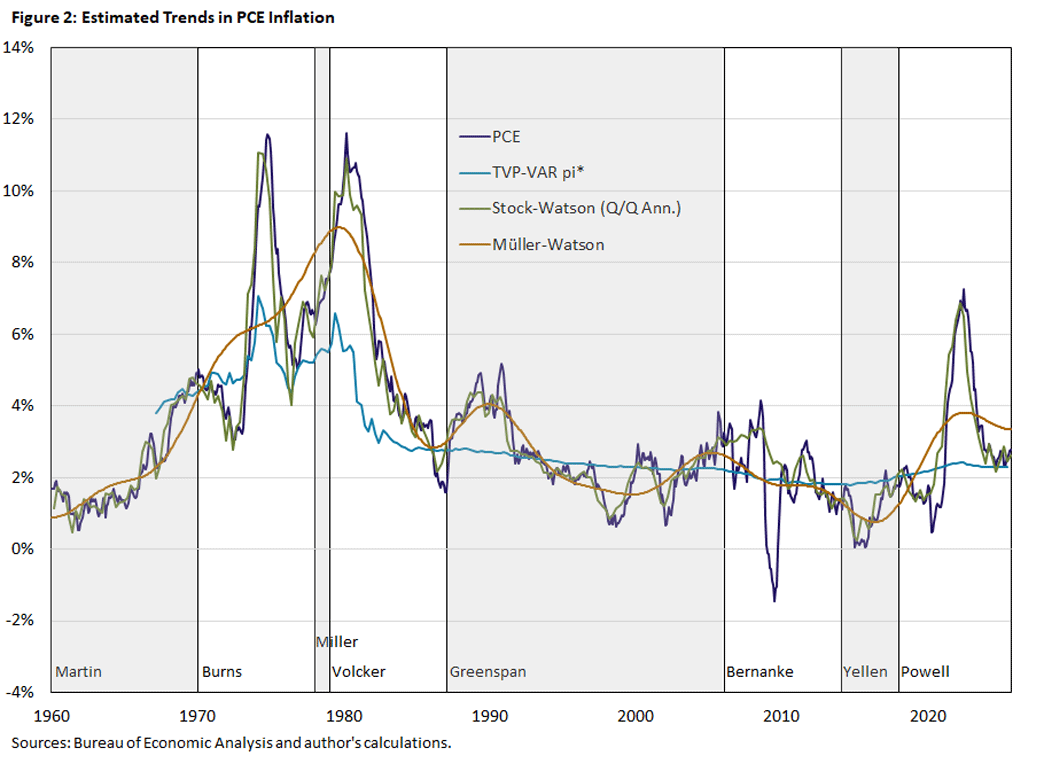
In this article, I compare three empirical estimates of the trend in inflation using data from the period 1960-2025. I focus on the headline inflation rate as captured by the rate of change in the personal consumption expenditure (PCE) price index. PCE inflation is the Federal Reserve's preferred inflation measure and the one it uses in its inflation target of 2 percent.2 The estimated inflation trends are shown in Figure 2 together with the underlying PCE inflation rate as well as the respective tenures of Fed chairs from William McChesney Martin to Jerome Powell.
Trend Inflation Is ... Inflation Without Noise
The first trend inflation estimate is based on the empirical model developed by economists James Stock and Mark Watson in their 2016 paper "Core Inflation and Trend Inflation."3 Their model is what is known as an unobserved component model. The object of interest — namely the inflation trend — is considered unobserved (or even unobservable) but is assumed to follow a unit root process. A unit process (or, often used interchangeably, a random walk) is a convenient modeling device for capturing trending behavior. Its most elementary feature is that it is not mean reverting. That is, it does not return to its long-run value and can therefore exhibit trending behavior for long periods of time.
The difficulty with unobserved component models is that there are substantial degrees of freedom in pinning down the trend since the model must decide which parts of an inflation observation are due to the trend and which are due to temporary factors. One way to approach this identification issue is to tightly restrict by how much the unobserved component is allowed to move. Another way is to bring in additional information. Stock and Watson primarily do the latter by using sectoral price data and estimating a common component in the different sectors, which is likely related to the aggregate inflation trend.
In Figure 2, the estimated Stock-Watson (SW) trend follows the underlying PCE inflation data very closely, especially the ups and downs of the Great Inflation episode in the 1970s and the pandemic inflation of the early 2020s. It does not track other large inflation movements, such as the drops in 1987 and 2009, but overall the SW trend essentially replicates PCE inflation without noisy or high-frequency movements. In other words, SW trend inflation is an inflation measure that gives a clean view of the current state of price pressures.
Trend Inflation Is ... What You're Good at Forecasting
The second trend inflation model is based on an approach developed by Watson and economist Ulrich Müller in a series of papers.4 Their approach rests on the idea that a trend should not move around too much but should also not require a specific stochastic process as a representation of this trend, as in the case with the SW trend.
Heuristically, the trend in GDP from Figure 1 can be found by drawing a straight line through the data points. Similarly, an inflation trend could be found by drawing a line through the ups and downs of inflation in Figure 2. The question is: How much variation should this line have? Should it be none, in which case the trend would be more like a horizontal line at the mean? Or should it be a lot, in which case the Müller-Watson (MW) trend would look like the SW trend?
Müller and Watson's approach is to conceptualize the trend as a collection of very low-frequency movements. They recognize that there is not enough information in the typical datasets that economists use to credibly identify low-frequency movements or trends. Instead, they consider broad classes of smooth and slowly evolving specifications that are robust to model misspecification. The MW trend is then constructed by using a small number of weighted averages of the data where the weights indicate the degrees of uncertainty that the averages reveal about low-frequency movements.
Figure 2 shows the MW trend generally following the broad movements of PCE inflation but considerably less closely than the SW trend. In fact, the MW trend resembles what is perhaps commonly perceived as a trend (namely, smoothly evolving) and what can be drawn with a steady careful hand. Unlike the SW trend, it does not closely track the underlying data. In the pandemic inflation episode especially, MW trend inflation did not rise as much, suggesting that actual inflation was a transitory phenomenon.
Trend Inflation Is ... When Nothing Happens Anymore
The third trend inflation model is based on the time-varying parameter vector autoregression (TVP-VAR) model that economist Christian Matthes and I developed to estimate the natural real rate of interest (commonly referred to as r*).5 The trend of a variable in this model (or LM for short) is a medium-run to long-run forecast of the variable in question, with the current state of the economy represented by a set of key macroeconomic aggregates and policy variables. The TVP-VAR is a very flexible time-series model in which all components of the transmission mechanism (that is, the lag coefficients) and of the size and variability of the shocks hitting the economy are changing over time. This allows the model to quickly recognize and adapt to events such as structural change or economic instability as in the financial crisis or the pandemic.
The idea behind this trend concept is that transitory disturbances will have played out over time and no longer affect the economy. In the case of inflation, this also includes the time horizon over which monetary policy actions have effect and return inflation to its target level. In this sense, trend inflation π* (to preserve the parallel with r* in this model) should reflect the public's assessment of what the current perceived target level is and can serve as a metric for the credibility of policy.
The estimate of π* shown in Figure 2 is markedly different from the previous two trends. The estimated series is remarkably smooth. Visually, there are two separate periods:
- Until the early 1980s, π* follows the peaks and troughs during the Great Inflation of the 1970s similar to the SW trend but not hugging it as closely.
- In the 1980s, π* drops rapidly from nearly 6 percent to 3 percent. It then declines smoothly and gradually to 2 percent.
This pattern is in line with a view of the Fed's anti-inflation measures of the early 1980s — also known as the Volcker disinflation after then-Fed Chair Paul Volcker — having changed the nature of the inflation process and monetary policymaking. During this time, the model interprets inflation deviations as transitory movements that FOMC policy counteracts by bringing inflation back to trend. The experience of the 1970s is different as the trend is moving around quite a bit, consistent with the view of the Great Inflation as the outcome of policy mistakes. At the same time, the trend has been consistently above target for most of the sample period, reaching 2 percent only before the financial crisis. In fact, π* was below target from the first quarter of 2008 through the second quarter of 2017. It reached the trough of 1.79 percent in the third quarter of 2014. The LM trend then increased steadily during the pandemic, reaching its current level of 2.3 percent. Notably, the trend did not rise as much as the other two trends.
The Pandemic Inflation and Its Trends
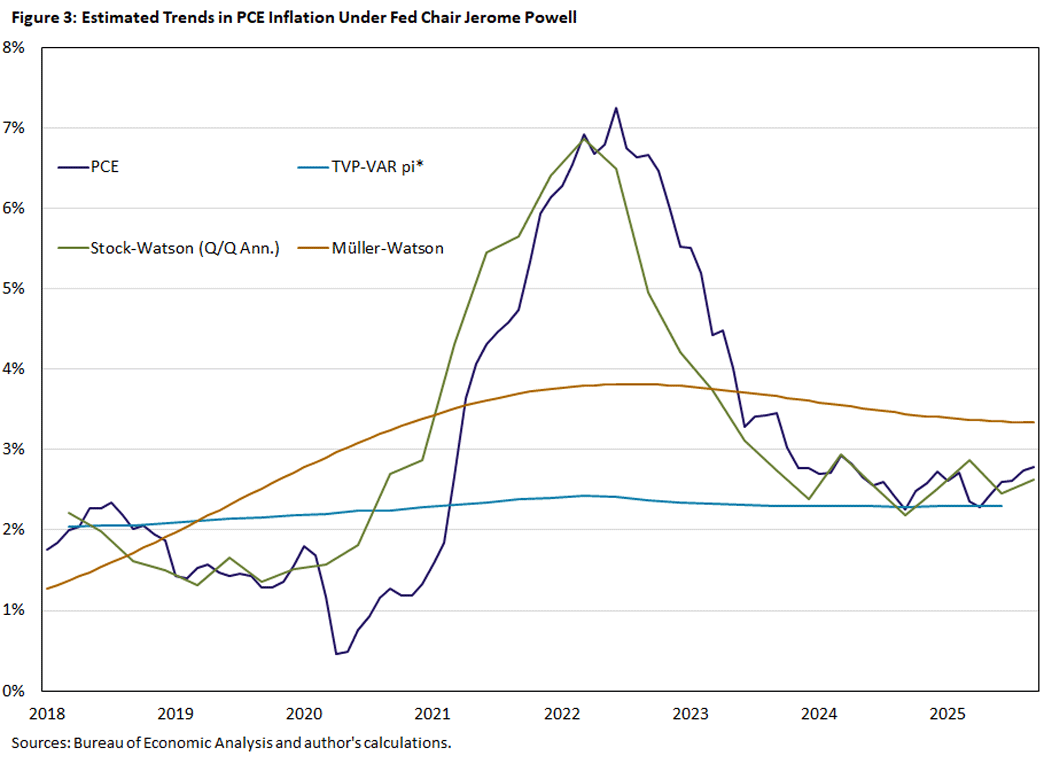
Figure 3 zooms in on the tenure of Jerome Powell as chair of the FOMC and shows the characteristics and behavior of the three trend inflations measures more closely, especially during the pandemic inflation period.
The SW trend tracks actual inflation closely but appears to lead it during the pandemic inflation episode, both on the upswing and on the downside. In other words, there were components in PCE inflation that made it appear artificially low in early 2021, while the SW trend (cleaned from this noise) already signaled the coming inflation. A similar pattern applies in early 2022 when trend inflation peaked before actual inflation. For a policymaker, this is useful information since it shines a light on underlying inflation pressures.
The MW trend is much smoother over this period. It rises with the general upswing in inflation, but the trend never goes above 4 percent. It also barely declines after inflation dropped below 3 percent in late 2023. As discussed above, the MW trend does not rely on a specific model but uses the information available on very low-frequency components from the existing data in a heuristic manner. One interpretation of the recent pattern is that there are still considerable underlying trend forces in the current inflation readings that policymakers may miss. While the SW trend essentially gives an "all-clear" picture — (meaning inflation is at trend and close to 2 percent — MW signals caution.
The LM trend, on the other hand, paints an entirely different picture. At the beginning of Powell's tenure at the Fed, π* was at the inflation target level of 2 percent. Over the next seven years, it increased mildly to 2.3 percent, as the estimate was almost automatically pulled upward by the actual rise in inflation. Since the inflation peak, π* stabilized at 2.3 percent. As discussed above, one interpretation of the LM trend is as an assessment of the credibility of the inflation target. Despite the pandemic experience — when inflation behaved in a manner not seen for 40 years — the credibility of the Fed held steady according to this metric.
What Is Trend Inflation?
I began the article by asking: What is trend inflation? The somewhat facetious answer to this question is: Trend inflation is whatever you want it to be. The three models of trend inflation give strikingly different estimates. So perhaps a better question would be: What is the purpose of a specific trend model for the policy process?
The SW trend can give policymakers a measure of current inflation cleaned of highly transitory movements that do not have any bearing on the longer inflation outlook. The MW trend indexes on these low frequency components and alerts policymakers to underlying inflation pressures. The LM trend allows policymakers a glimpse into whether current inflation is eroding the credibility of their target.
All three trend inflation metrics are credible and plausible concepts, but which should be preferred? In 2020, they all signaled incipient inflation, while currently they all offer different assessments. Perhaps the best answer to the question posed in the title is to retire the use of "trend" inflation for good.
Thomas Lubik is a senior advisor in the Research Department at the Federal Reserve Bank of Richmond.
1
A constant long-run growth rate — that is, the percentage change from one period to the next — leads to exponential growth because of compounding. It is therefore often visually convenient to show a trending variable on a logarithmic scale, which shows up as linear growth trend. The average growth rate can then be read off the slope of a regression line.
2
As discussed in the Federal Open Market Committee's 2025 Statement on Longer-Run Goals and Monetary Policy Strategy (PDF), the FOMC judges "[...] that inflation at the rate of 2 percent, as measured by the annual change in the price index for personal consumption expenditures, is most consistent over the longer run with the Federal Reserve's statutory maximum employment and price stability mandates."
3
This model is discussed in more detail in the 2023 article "What Does Sectoral Inflation Tell Us About the Aggregate Trend in Inflation?" by Watson and economist Paul Ho. It also underlies the New York Fed's Multivariate Core Trend Inflation model.
4
The most accessible introduction to their approach can be found in their 2019 paper "Low-Frequency Analysis of Economic Time Series (PDF)."
5
The full specification of the TVP-VAR model can be found in the 2015 paper "Time-Varying Parameter Vector Autoregressions: Specification, Estimation, and an Application" by Matthes and me. The 2015 article "Calculating the Natural Rate of Interest: A Comparison of Two Alternative Approaches" discusses the original r* model, and the 2023 article "The Stars Our Destination: An Update for Our R* Model" provides a recent update.
To cite this Economic Brief, please use the following format: Lubik, Thomas A. (April 2026) "What Is Trend Inflation?" Federal Reserve Bank of Richmond Economic Brief, No. 26-11.
This article may be photocopied or reprinted in its entirety. Please credit the author, source, and the Federal Reserve Bank of Richmond and include the italicized statement below.
Views expressed in this article are those of the author and not necessarily those of the Federal Reserve Bank of Richmond or the Federal Reserve System.
Subscribe to Economic Brief
Receive a notification when Economic Brief is posted online.
Contact Us