The Stars Our Destination: An Update for Our R* Model
We report and discuss recent estimates of the natural real rate of interest, denoted r*. We analyze how the current flow of data renders r* estimates less reliable, and we consider some changes in the specification of the long-standing Lubik-Matthes model.
The natural real rate of interest — denoted as r* — is a key concept in monetary policy. It is the equilibrium level of the real interest rate (computed as the nominal policy rate less a measure of inflation) when the economy is at its long-run trend level of growth with inflation at the Federal Reserve's target and when there are no excess supply or demand pressures. Policymakers can use r* as a metric for gauging how expansionary or contractionary policy is or should be.
The unfortunate drawback of r* is that it is unobserved and thus must be inferred from actual data by use of theoretical or empirical models. We developed an empirical model of r* in 2015,1 and the so-called Lubik-Matthes r* is estimated and reported quarterly. In this article, we discuss some recent challenges encountered during the pandemic years and explain some recent changes we made to the empirical model.
The Stars Are Aligned in Richmond
The data flow during and after the pandemic was challenging for economic forecasters and modelers. Key macroeconomic aggregates exhibited a volatility that researchers had not seen in decades (if ever). Moreover, the possibility of structural shifts in the economy — such as permanent changes in the labor force, the rearranging of economic activity or changes in work habits — could render existing economic models obsolete.
At the same time, knowledge of r* took on added importance during the pandemic and over the recovery as the FOMC reduced its policy rate to the zero lower bound (ZLB) in March 2020. When the economy recovered and growth picked up strongly, inflation reared its ugly head with headline prints close to 10 percent, levels that not been seen since the 1980s.
Eventually, the FOMC attempted to rein in inflation with a sequence of sharp rate increases starting in March 2022. Given the unprecedented nature of the economic environment, r* has emerged as an important guidepost for the stance of policy, especially since the FOMC appears close to ending its hiking cycle as inflation has come down.
During the pandemic and subsequent recovery, the Richmond Fed continued producing its r* estimate based on the Lubik-Matthes time-varying parameter vector autoregression (TVP-VAR) model. The model's specification of time variation is designed to capture structural shifts and changes in volatility. Other statistical models used for forecasting purposes and for estimating r* found this a challenging environment.2 In fact, perhaps the most well-known r* estimate — based on the original work of economists Thomas Laubach and John Williams (who were later joined by Kathryn Holston on an updated model) and produced by the New York Fed — stopped reporting estimates during the pandemic and only resumed reporting in May 2023.3
How Far Away the Stars Seem
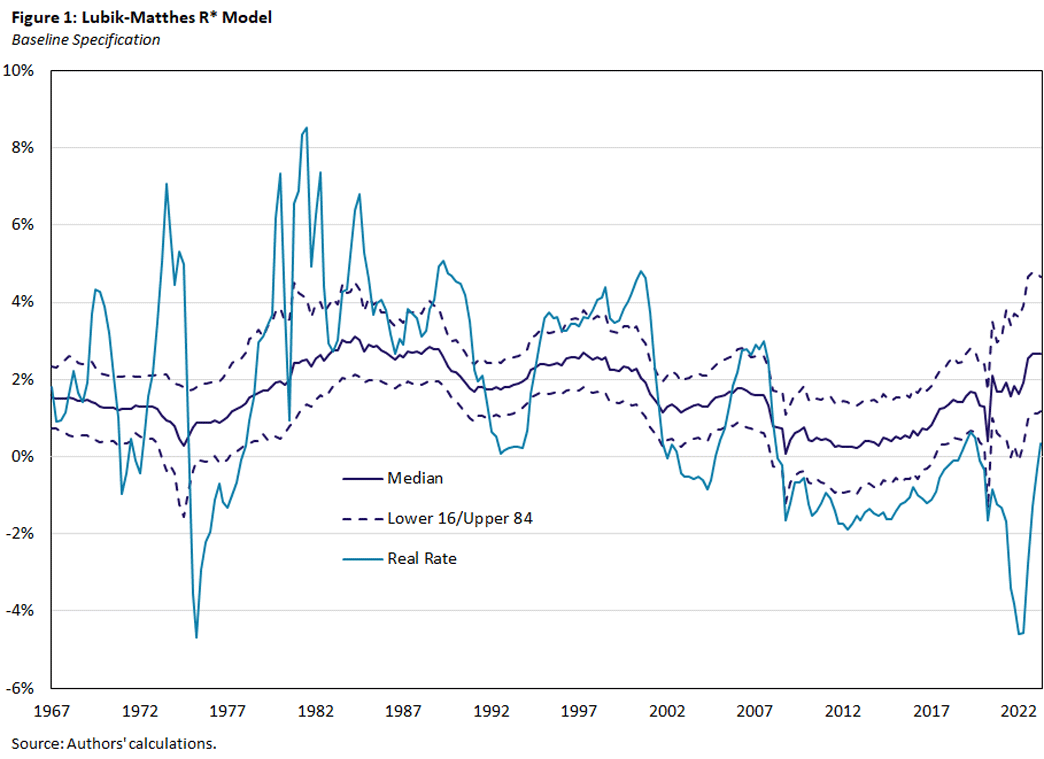
Estimates of r* from the Lubik-Matthes model and the Holston-Laubach-Williams model have notably diverged over the last two years.4 Our r* measure steadily has steadily increased from a low of 0.44 percent in the second quarter of 2020 to 2.16 percent in the first quarter of 2023, while the Holston-Laubach-Williams r* measure declined from 0.92 percent to 0.57 percent over the same period.
Figure 1 shows the most recent path of our r* updated using second quarter data. It is based on the standard specification we have used for years. The uncertainty regions cover the area where the estimates are likely to fall with two-thirds probability. The update yields a second quarter estimate of 2.65 percent, which is substantially higher than the previous estimate of 2.16 percent in the first quarter. Moreover, the entire path of r* shifted upwards, including a revision of the first quarter estimate to 2.65 percent as well.
My God, It's Full of Stars
To better understand the recent behavior of our r* estimate, we conduct a few experiments with the mechanics of the model. There are two key issues at play:
- Is the specification of the model still appropriate for capturing the underlying dynamics of the economy following the pandemic?
- Does the model specification exhibit excess sensitivity to the most recent data?
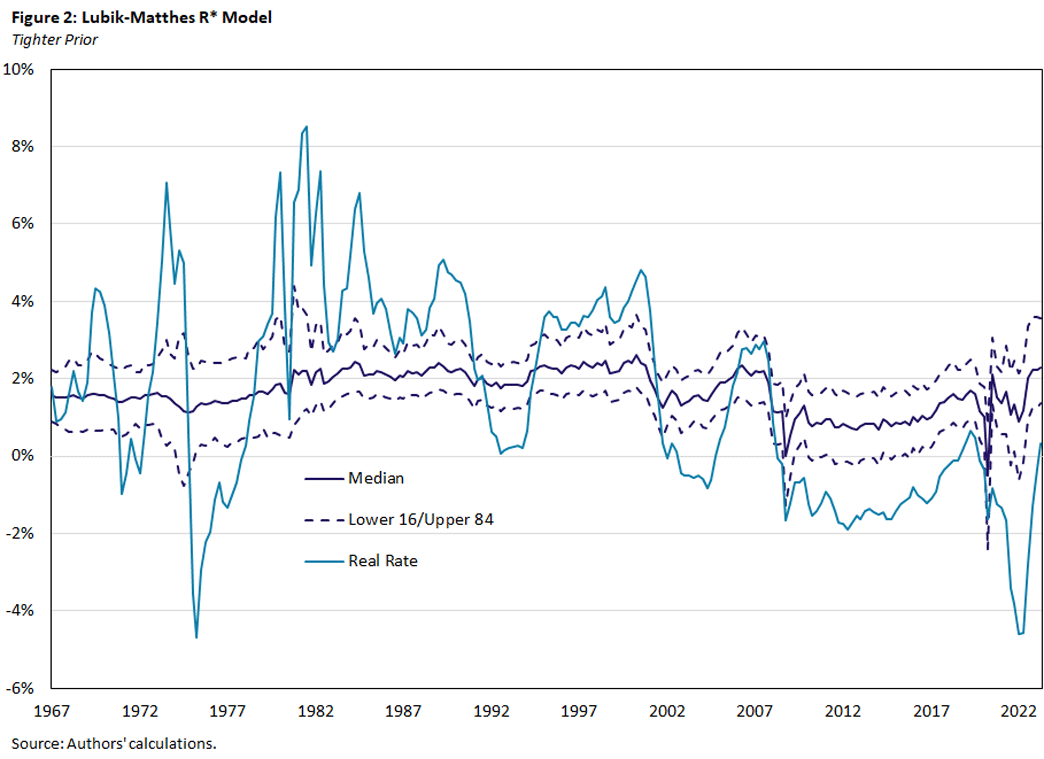
Figure 2 takes a stab at the first question.5 It shows an alternative estimate of r* where we have reduced the extent to which the coefficients of the model are allowed to vary. It results in a smoother, less variable path for r* over the estimation period but still shows a noticeable uptick at the end of the sample towards a current estimate of 2.28 percent.
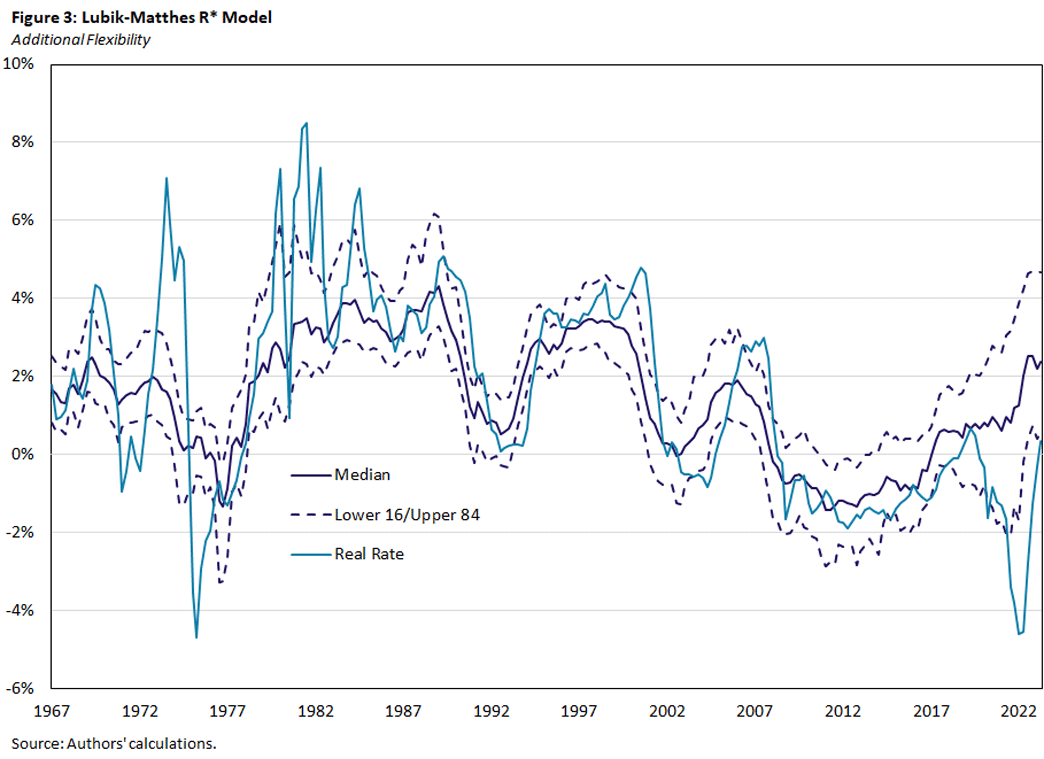
In contrast, Figure 3 shows a specification that allows much more flexibility in the model coefficients. The estimated r* path tracks the actual real rate much more closely in how it follows its ups and downs. The current estimate of r* under this specification is 2.48 percent. Although the initial pandemic shock in 2020 is not immediately visible in the median r* path, the error bands for this looser specification do pick up the pandemic asymmetrically.
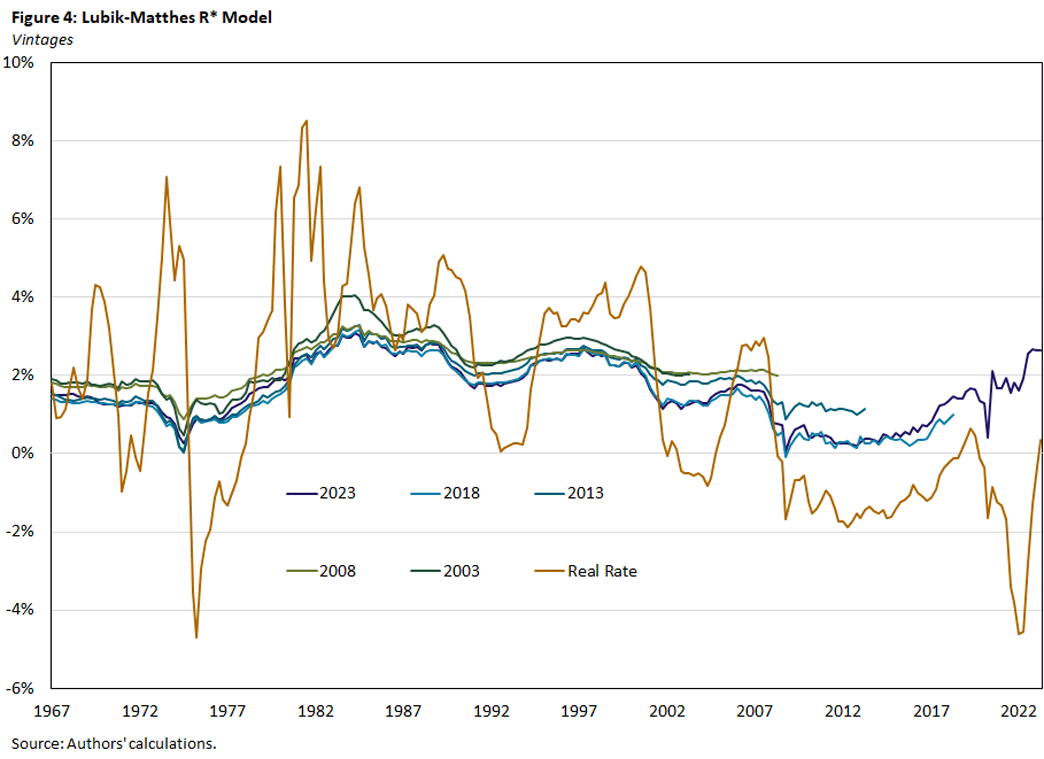
The second set of exercises considers the possibility that estimation in real time introduces spurious excess volatility in the estimates. Initial data releases are known to contain measurement error and are often subsequently revised.6 We investigate this issue by estimating the TVP-VAR on data from the Philadelphia Fed Real-Time Data Research database and contrasting the resulting real-time r* with the estimates based on a lengthier sample and including data revisions.
Figure 4 shows such an example. The figure depicts estimated paths of r* for different vintages of data. The real-time vintages are in five-year intervals going backwards from just before the onset of the pandemic. Estimates based on these vintages show what policymakers would have known at the specific dates. For instance, before the Great Recession in 2007-09, the r* estimate was close to 2 percent. With knowledge of the downturn and the low interest rate period of the 2010s, the actual estimate — with the benefit of hindsight — turned out to be considerably lower. Moreover, the entire path implied by the 2008 vintage also shifts downward considerably.
It is thus noteworthy that once more data are available — with the implicit assumption that measurement errors have disappeared after subsequent revisions — the estimates settle on often quite different values than initially implied by real-time estimates. One lesson from this analysis is that the true r* values are unlikely to shift substantially period by period. Thus, more conservatism is warranted.
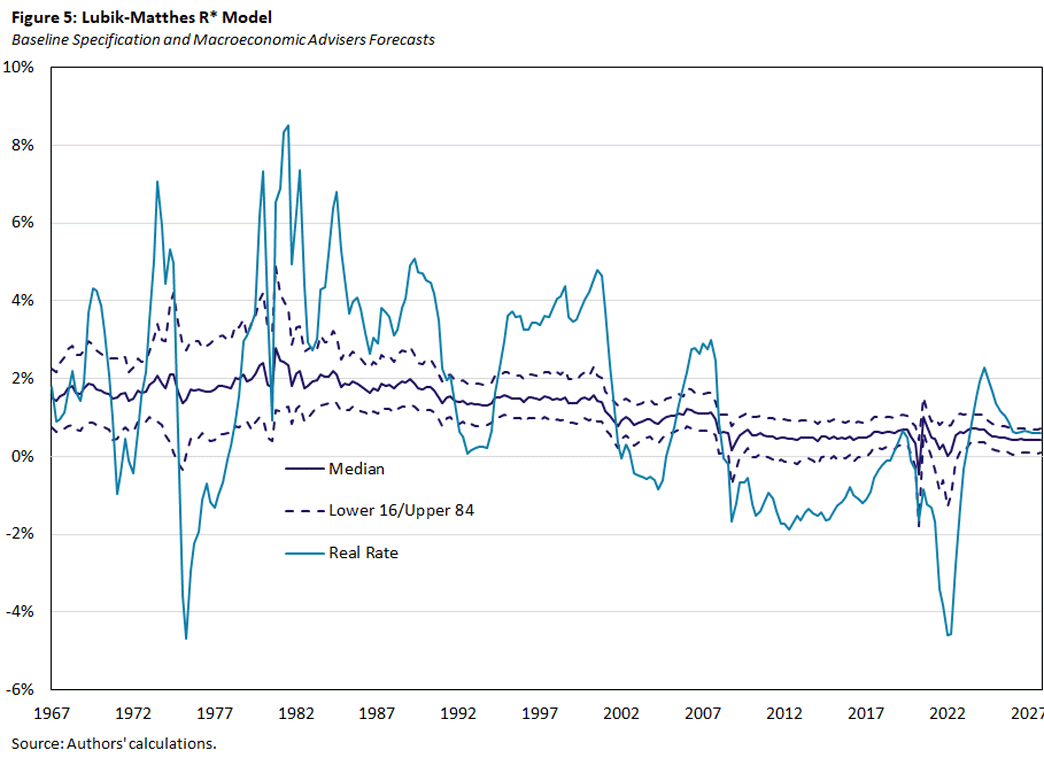
We try to replicate this backward-looking analysis by appending a forecast to the current data set. We use the forecast available from Macroeconomic Advisers for four years ahead. The results are shown in Figure 5. While the current actual data still contain measurement error, we see that the r* estimate settles to a perhaps surprisingly low value of 0.66 percent.
These findings imply that the current specification and procedure overestimates the value of r* for two primary reasons:
- Too much room for volatility in the specification
- Real-time data issues such as measurement error
At the same time, the current environment is perhaps special in that the economy has seen a sharp rise in inflation following a long period of inflation at or below target, while at the same time the policy rate was at or close to the ZLB. This pattern reverted with sharp rate hikes and inflation gradually falling.
This suggests the possibility that the local trend in the real rate dominates the estimates. The tighter the prior on the time variation in parameters, the larger seem the movements in the median natural rate.
The Future Is in the Stars
Based on these insights, we therefore decided (for the time being) to change the TVP-VAR specification to one that restricts the variability of the model parameters. Given the extraordinary circumstances of inflation unseen in two generations and of subsequent sharp policy rate hikes, we feel that our original baseline specification extrapolates too much on recent data. Consequently, we decided to tame the algorithm somewhat by allowing less variability. This results in a less volatile r* series that reflects more closely our prior belief as to where r* likely is. It still results in an increase of r* to 2.28 percent for the reasons outlined above.
Thomas A. Lubik is a senior advisor in the Research Department at the Federal Reserve Bank of Richmond. Christian Matthes is an economics professor at Indiana University.
Additional information about the model's construction can be found in our 2015 paper "Time-Varying Parameter Vector Autoregressions: Specification, Estimation and an Application" and our 2015 article "Calculating the Natural Rate of Interest: A Comparison of Two Alternative Approaches."
The 2022 paper "Forecasting in the Absence of Precedent" and the 2021 article "How Macroeconomic Forecasters Adjusted During the COVID-19 Pandemic" by Paul Ho of the Richmond Fed discusses these challenges and examines alternative approaches to mitigate the data issues.
The New York Fed now produces three different r* estimates: the original based on the 2003 paper "Measuring the Natural Rate of Interest," an updated version that utilizes international data and linkages (discussed in the 2017 paper "Measuring the Natural Rate of Interest: International Trends and Determinants") and a post-pandemic revision of that same model allowing for additional supply shocks to model supply-chain disturbances (discussed in the 2023 working paper "Measuring the Natural Rate of Interest After COVID-19 [PDF]").
This observation attracted much attention among commentors and economists. A thread by economist David Beckworth illustrates that the two r* estimates essentially bound market-based measures of long-run real rate expectations. While on the one hand comforting — in the sense that policy is broadly correct — it also illustrates the degree of uncertainty surrounding the natural real rate of interest.
In all specifications, we only change how much the lag coefficients of the model are allowed to change, while the extent to which stochastic volatility can affect the estimates remains fixed. The advantage to having time-variation in the volatility of the shocks is that it can capture extreme events (such as the pandemic) that potentially have no long-run effects. That is, if the data exhibit sharp increases then sharp decreases from one period to the next, the model prefers changes in volatilities as an explanation. On the other hand, the longer the model sees persistently high (or low) levels of variables, the more likely it assesses that parameters other than volatility parameters have changed.
We use this observation in our paper "Indeterminacy and Learning: An Analysis of Monetary Policy in the Great Inflation" to interpret the Great Inflation of the 1970s as the outcome of substantial data mismeasurement, which led to ex-post suboptimal policy.
To cite this Economic Brief, please use the following format: Lubik, Thomas A.; and Matthes, Christian. (September 2023) "The Stars Our Destination: An Update for Our R* Model." Federal Reserve Bank of Richmond Economic Brief, No. 23-32.
This article may be photocopied or reprinted in its entirety. Please credit the authors, source, and the Federal Reserve Bank of Richmond and include the italicized statement below.
Views expressed in this article are those of the authors and not necessarily those of the Federal Reserve Bank of Richmond or the Federal Reserve System.
Receive a notification when Economic Brief is posted online.


