

Is the US Economy K-Shaped? Evidence From the Past Three Decades
Key Takeaways
- We examine whether the U.S. economy has exhibited "K-shaped" behavior — outcomes for low-income and high-income households moving in opposite directions — over the past three decades.
- The U.S. economy has not been persistently K-shaped, though income growth showed K-shaped patterns during the recoveries from the 2001 and 2007-09 recessions.
- Even though income growth has not always been K-shaped, growth rates have been substantially larger for high-income households than for low-income households over the 30-year period we examined.
- Measured consumption growth has been less divergent than income growth across income groups. Consumption is K-shaped over the 2021-23 period even though income is not.
Many observers believe that the U.S. currently has a "K-shaped" economy, where outcomes for high-income and low-income households move in opposite directions: High-income households climb the upper arm of the K, while low-income households slide down the lower arm.
In this article, we assess whether the U.S. economy has exhibited this K-shaped behavior over the past three decades. With respect to income growth, we find that K-shapes are evident in the wake of the 2001 and 2007-09 recessions but less so after the COVID recession. With respect to consumption, data from the Bureau of Labor Statistics' Consumer Expenditure Survey (CE) show only modest evidence of K-shaped behavior after the 2001 and 2007-09 recessions. In contrast, consumption is K-shaped over the 2021-23 period even though income is not.
What Is a K-Shaped Economy?
There is no single accepted definition of a K-shaped economy, and recent analyses differ both in how they group households and in the outcomes they examine.1 For the purposes of this article, we describe the economy as K-shaped when economic outcomes for high-income households improve over time while outcomes for low-income households worsen.
This is in some ways a rather strict definition. For example, we would consider an economy in which income growth for low-income households is positive but only half that of high-income households to not be K-shaped.
Our analysis uses data from the Annual Social and Economic Supplement of the Current Population Survey (CPS), housed at IPUMS.2 Our unit of analysis is the household.3 To group households, we rank them by household income and bin them into quintiles (five equally sized groups). We label the bottom 20 percent "low income," the top 20 percent "high income" and the middle 60 percent "middle income."4 We will apply the same definition when using data from the CE.
Income and Its Growth Over the Past Three Decades
We begin by describing income and its growth over the past three decades. Throughout, we use after-tax income, since that is what a household has available to spend or save after paying taxes and/or receiving transfers.
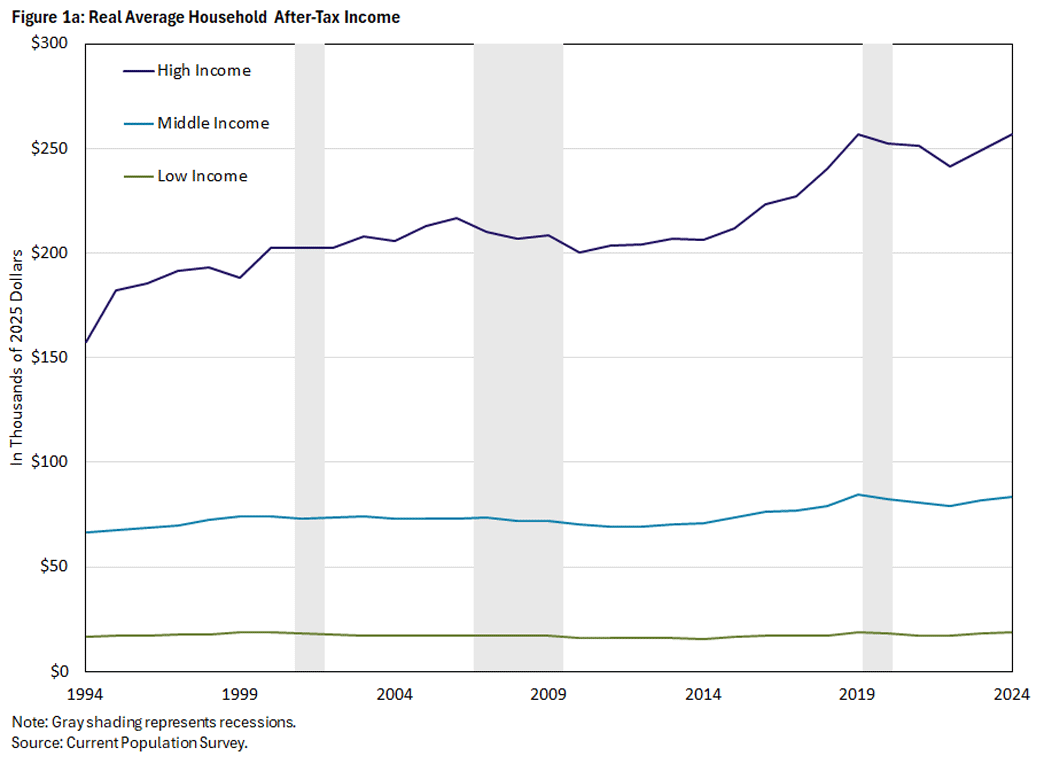
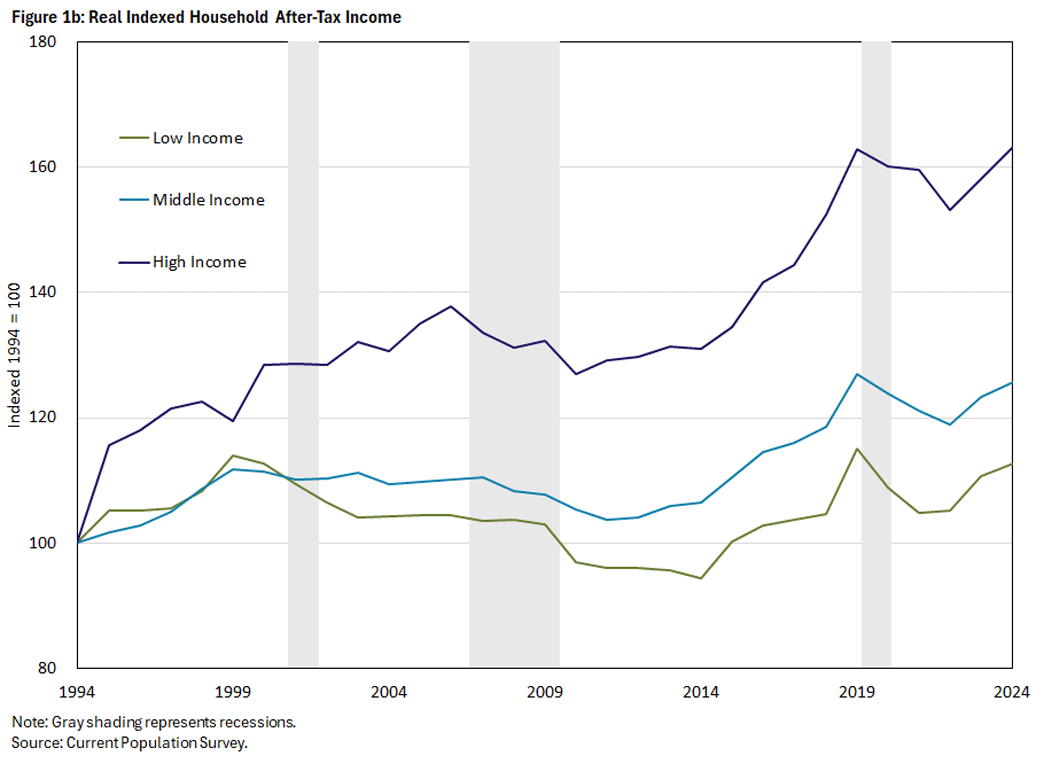
Figure 1a shows average income (in 2025 dollars) for our three groups for the period 1994-2024, and Figure 1b shows cumulative income growth over the same period, found by indexing each group's real income to its 1994 value, which we set to 100.
Two patterns are evident:
- Average income has grown for all three groups.
- Average income has grown fastest for high-income households.
Over the three decades we consider, low-income households saw their average real income grow by about 13 percent, middle-income households by roughly 26 percent and high-income households by close to 63 percent. Thus, the overall pattern in Figure 1 does not meet our definition of a K-shaped economy because real income rose for every group, including low-income households. Nonetheless, the figure shows widening income dispersion: While incomes have risen across the board, high-income households have experienced substantially higher income growth.
On the other hand, Figure 1 also shows that there have been periods where the economy has indeed been K‑shaped by our definition, namely in the recoveries from the 2001 and 2007-09 recessions. Specifically, real income for low-income households fell while real income for high-income households grew between 2002 and 2006 and again between 2010 and 2013. Moreover, our data show that K-shaped episodes are for the most part not followed by steep recoveries, implying that these seeming temporary losses have long-term consequences.
Previous research has documented such differences in recoveries across income groups. For example, in the 2020 paper "The Rise of U.S. Earnings Inequality: Does the Cycle Drive the Trend?," authors Jonathan Heathcote, Fabrizio Perri and Giovanni Violante use CPS data from 1967 to 2018 to document that, among prime-age men, hours and earnings at the 20th percentile fell during recessions and did not subsequently fully recover.
The recovery after the COVID recession does not exhibit a K-shape by our definition, as income for the three groups moved in tandem. As we discuss below, transfers contributed to widespread income growth after the COVID recession.5
The Role of Income Sources
To better understand the patterns in Figure 1, we split income into three components:
- Earnings (including business and farm income)
- The net of taxes paid to and transfers received from the government
- All other sources
Figure 2 indexes each component to 1994.
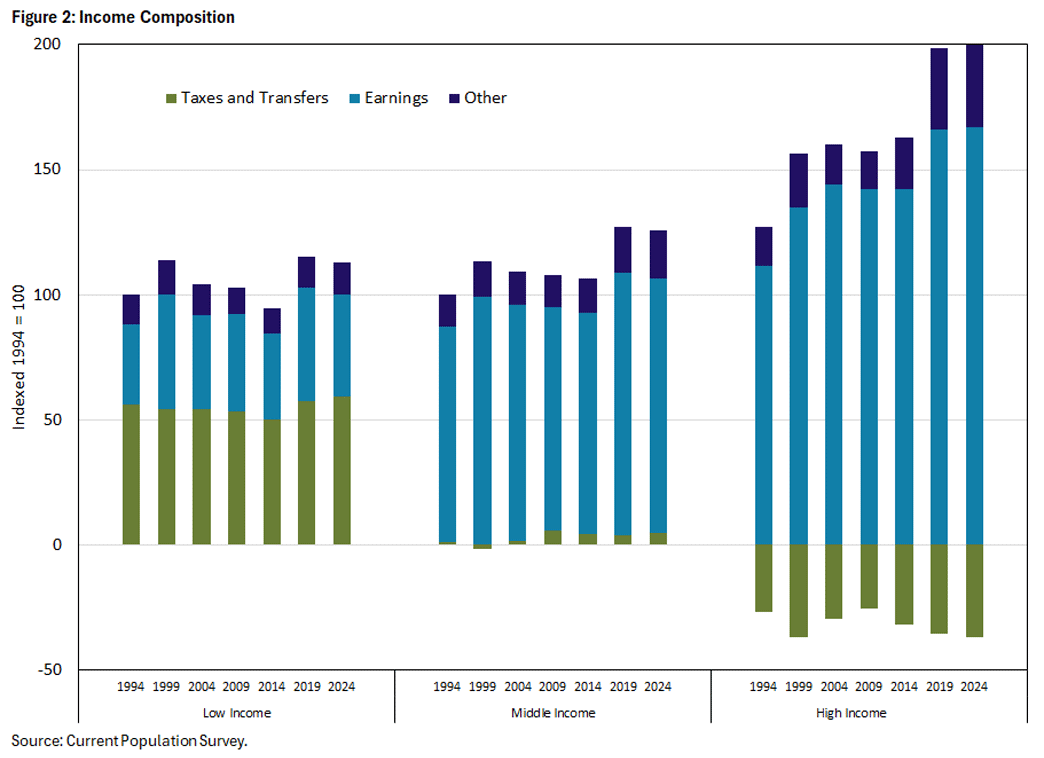
For high-income households, earnings are both the largest single source of income throughout the period and the largest source of income growth. In contrast, their taxes-and-transfers component is negative: These households pay more in taxes than they receive in transfers from the government.
Low-income households present something close to a mirror image. For them, the net of transfers and taxes is not only positive but large: Over the period, more than half of their income reflects transfers exceeding taxes. Notably, the growth in their income between 2014 and 2024 was driven largely by this component rising, rather than by gains in earnings or other income.
Middle-income households are also net beneficiaries, if only modestly, of taxes and transfers, but like high-income households, they have also experienced gains in other income.
Over the three decades we consider, high-income households have seen the largest earnings growth, and differences in earnings growth have contributed to the K-shaped periods. Notably, between 1999 and 2004, real earnings grew for the high-income group but shrank for other households. High-income households also saw the highest growth in "other" income sources such as interest and dividends on their assets.

Related Listening
In the June 17, 2026 episode of the Speaking of the Economy podcast, Urvi Neelakantan described how employment, income growth and consumption can differ between groups of households and reviewed recent trends in this divergence of economic outcomes.
Why Mobility Matters
Because the CPS is a repeated cross section, we do not track households over time but instead group the households surveyed each year into bins for that year. But the households in each group need not be the same from one year to the next: Whether they are or not depends on income mobility.
At one extreme, if economic mobility were random — say, a 50-50 coin toss determined whether a household landed in the low-income or high-income group each year— no household would be stuck on either arm of the K. Over a lifetime, a household would spend about as much time at the top as at the bottom. Assuming a symmetric K-shape, that household's average income would settle between the two arms.
One reason a household might move up and down the income distribution is that its earnings change over its life cycle. Consider young, single, early-career householders. Their earnings would be low, possibly placing them on the lower arm of the K. As they gain experience and seniority, their earnings would rise, and they might also become part of a dual-earner couple. This could put the household on the upper arm of the K. On the other hand, shocks such as disability may send them down the lower arm.
Nonetheless, income mobility is low in the U.S. In other words, households residing on either arm of the K (or in the middle) are likely to remain close to where they started in the relative income distribution.6
Does Consumption Tell the Same Story?
Income matters chiefly for what it buys households, literally. Households can spend their income to consume now, save it to consume later or use it to repay debt that allowed them to consume in the past. Because consumption is central to material well-being, it is arguably a more relevant measure of how households fare in the long run. What shape does consumption and its growth exhibit? Following the same procedure as we did for Figure 1b, Figures 3a and 3b show real consumption and indexed consumption by income group over the same three decades. Here, we use data from the CE.
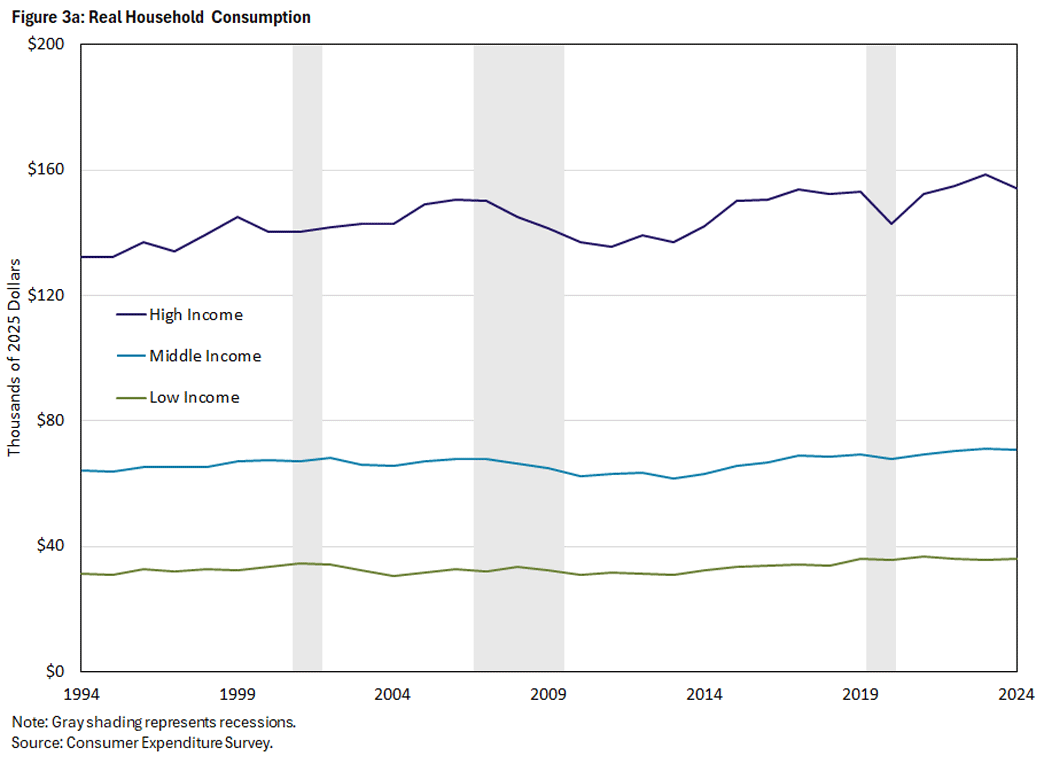
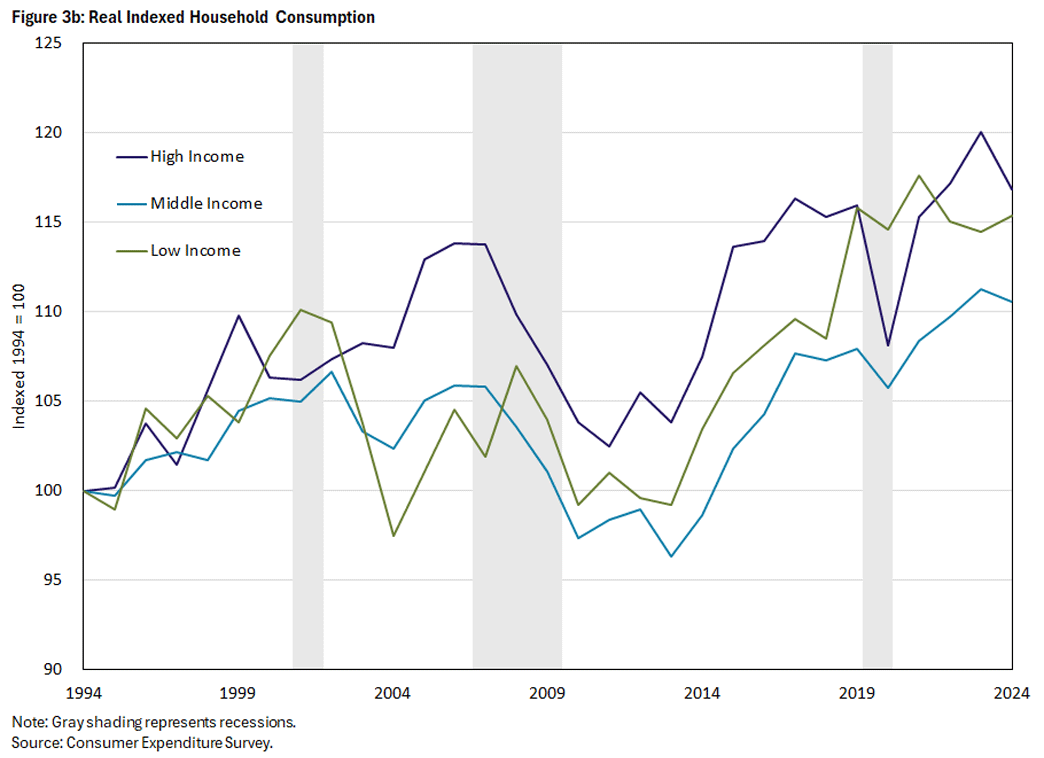
Two trends bear noting. The first is that the dispersion in consumption growth is much smaller than the dispersion in income growth. Part of this difference is due to saving and borrowing. Households do not spend exactly what they earn each year. Instead, they smooth their consumption over time, borrowing or running down savings when their income is low and saving when income is high. The tax and transfer system also plays a role: When progressive, it redistributes income from high-income to low-income households.
However, there is evidence that the CE understates the spending of high-income households. Over time, the aggregate consumption levels implied by the CE have fallen relative to that reported in the Bureau of Economic Analysis' National Income and Product Accounts. This discrepancy appears to be concentrated in spending on luxury items, and correcting for it greatly widens the dispersion in consumption growth.7
The second trend is that consumption growth has largely moved in tandem for the three income groups. Nonetheless, modest K-shapes are visible in 2002-04, 2011-13 and 2021-23 (that is, after each recession). The behavior of consumption in 2021-23 is particularly notable, as income is not K-shaped over this period and the consumption of middle-income households rises rather than falls.
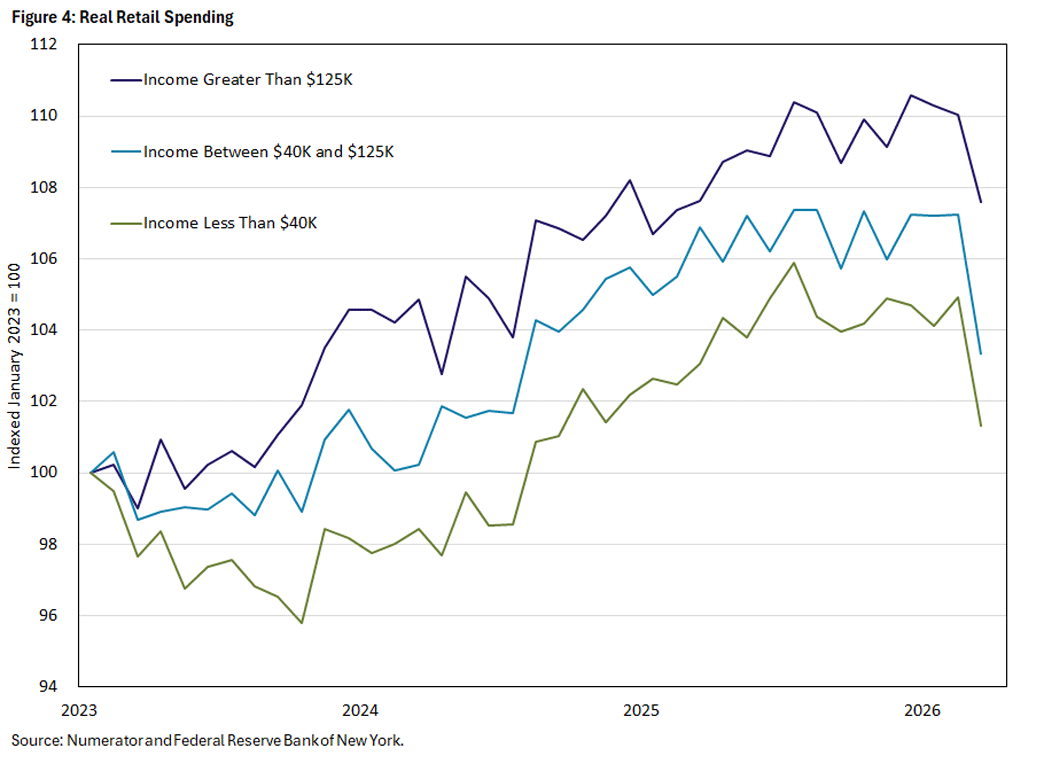
In Figure 4, we consider an alternative measure of consumption, constructed by the firm Numerator and tabulated by the Federal Reserve Bank of New York.8 These data are quite recent, running from the beginning of 2023 through the first quarter of 2026. Although the data show a K-shape in 2023, consumption spending from 2024 forward rose uniformly across all income groups before falling in the most recent period.
Discussion
So, is the economy K-shaped? By our definition, the U.S. economy has not been persistently K-shaped over the past three decades. However, income growth has exhibited a K-shape in the recoveries from the 2001 and 2007-09 recessions. The pandemic recovery has differed from these two previous episodes, with income rising for all three groups, supported by positive transfers to low-income households.
Although the consumption data also exhibit K-shapes, they are considerably less pronounced, in part because of the ability of households to smooth consumption over time and in part because of taxes and transfers. It is probable, however, that the consumption data we use underestimate spending on luxuries, making the divergence appear smaller than it is. On the other hand, consumption exhibits a K-shape after the COVID recession, while income does not.
We have not discussed the role of wealth in generating income or funding consumption. Wealth data are available but at lower frequencies and with longer lags than income or consumption data. When recent data become available, we can use them to assess the role of wealth in the current recovery.
We close by underscoring the importance of mobility and persistence. Households on each arm of the K tend to stay there, and modest differences in recoveries can lead to large differences in outcomes over a lifetime.
Kyle DeMaria is a regional economist and advisor for workforce pathways, John Bailey Jones is vice president of macroeconomic analysis, Joseph Mengedoth is a regional economist, and Urvi Neelakantan is a senior policy economist, all in the Research Department at the Federal Reserve Bank of Richmond.
See, for example, the 2026 article "Have U.S. Consumers Gone K-Shaped? A Review of the Data" by Jeff Horwich.
Data were downloaded from the University of Minnesota's Integrated Public Use Microdata Series (IPUMS) Current Population Survey.
The CPS reports the total income of each individual living in the household. Our measure of household income is the sum of all these individual income reports. This calculation "mechanically" raises the income of two-earner households relative to otherwise similar single-earner households. Nonetheless, household income is a simple measure of well-being that also captures life-cycle reasons for changes in income, as we discuss in the text.
Previous work that groups households similarly includes the 2018 commentary "There Are Many Definitions of 'Middle Class' — Here's Ours" by Richard Reeves and Katherine Guyot.
This "progressivity" of the COVID recovery has been documented in the 2023 paper "Earnings Business Cycles: The Covid Recession, Recovery and Policy Response" by Jeff Larrimore, Jacob Mortenson and David Splinter.
For example, the 2011 paper "Sources of Lifetime Inequality" by Mark Huggett, Gustavo Ventura and Amir Yaron finds that more of the variation in lifetime earnings, wealth and utility can be attributed to factors observed at age 23 than to events occurring later in life.
See the 2015 paper "Has Consumption Inequality Mirrored Income Inequality?" by Mark Aguiar and Mark Bils.
See the 2026 report "Tracking the K‑Shaped Economy: Who's Driving Spending?" by Rajashri Chakrabarti, Thu Pham, Beck Pierce and Maxim Pinkovskiy. We thank Chakrabarti and Pinkovskiy for helpful discussions about the data.
To cite this Economic Brief, please use the following format: DeMaria, Kyle; Jones, John Bailey; Mengedoth, Joe; and Neelakantan, Urvi. (July 2026) "Is the US Economy K-Shaped? Evidence From the Past Three Decades." Federal Reserve Bank of Richmond Economic Brief, No. 26-23.
This article may be photocopied or reprinted in its entirety. Please credit the authors, source, and the Federal Reserve Bank of Richmond and include the italicized statement below.
Views expressed in this article are those of the authors and not necessarily those of the Federal Reserve Bank of Richmond or the Federal Reserve System.


Receive a notification when Economic Brief is posted online.