Industry Employment: Losses & Gains, Recession & Recovery
Regional Matters
July 18, 2016
Dislocations in the labor market during the Great Recession were severe, and the recovery was slow. It took slightly more than four years for employment to recover to pre-recession levels in the Fifth District, and the unemployment rate remained higher more than six years after the end of the recession. The industry sectors that were the least affected witnessed rapid turnarounds once the recession ended. In contrast, those sectors that were most heavily impacted by the recession experienced very shallow recoveries with slow job growth and have yet to fully recover jobs lost during the recession.
The two sectors most negatively impacted during the downturn were the construction and manufacturing sectors. The collapse of the housing market resulted in a sharp downturn in employment in construction as well as in other sectors that feed into housing: retail and wholesale trade, transportation, finance, and manufacturing. The manufacturing sector was also heavily impacted by the broad decline in domestic and foreign demand for U.S.-produced consumer and industrial goods. The total decline in Fifth District employment in construction and manufacturing was 24 and 16 percent, respectively, from January 2008 to January 2010, far greater than the 5.6 percent decline in employment across all sectors. (Although the recession technically began in December 2007 and ended in June 2009, this post uses January 2008 and January 2010 to allow for full-year comparisons and minimize seasonality issues.) Notably, not only were these two sectors the most greatly impacted by the recession, they were the slowest to recover (excluding the information sector, where the continued decline in employment represents a structural rather than cyclical change). From January 2010 to May 2016, employment growth in the housing and manufacturing sectors increased 6.3 percent and 4.5 percent, respectively — well below the 9.8 percent rate for the entire Fifth District.
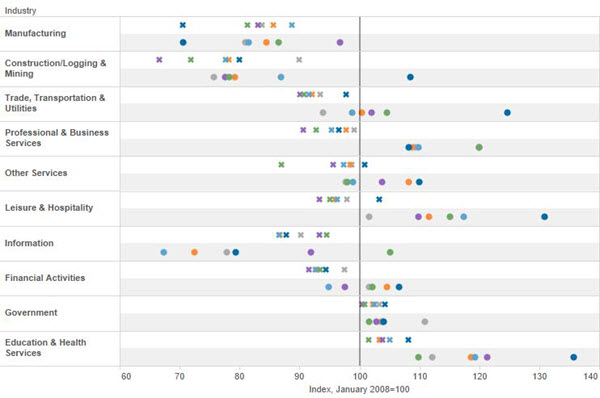
The chart below illustrates the employment losses during the downturn and employment gains since by industry for each of the six Fifth District jurisdictions. The level of payroll employment is indexed at 100 for January 2008, when payroll employment peaked in the United States, and then depicts the level of employment at January 2010, the trough in employment, with an "x" and the level of employment in May 2016 with a circle. An "x" at a point to the left of the 100 line would indicate that employment fell from January 2008 to January 2010. A circle to the left of the 100 line would indicate that the level of employment in May 2016 was below the level in January 2008 and the industry sector had yet to fully recover from the job losses experienced during the recession. In contrast, an "x" or a circle to the right of the 100 line would indicate that the level of employment was higher than January 2008. Of course, the farther an "x" or a circle is from the 100 line represents the greater the decline or increase. By depicting the level of employment in such a manner, the job losses and gains for each sector for each Fifth District jurisdiction can be described. For example, the January 2008 index level for professional and business services employment in South Carolina (the green "x") is 93 — indicating a 7 percent decline in employment from January 2008 to January 2010. The May 2016 level for professional and business services for South Carolina (the green circle) is well to the right of the 100 line, indicating that current employment is well above where it was prior to the Great Recession — at nearly 120, the level is close to 20 percent higher.
Returning to the manufacturing and construction sectors, job loss was severe across Fifth District jurisdictions, but there was considerable variation. At the extremes, manufacturing employment fell nearly 30 percent in the District of Columbia while the loss in Maryland was just 11 percent. These two jurisdictions do not have large manufacturing sectors, however. Virginia, North Carolina, South Carolina, and West Virginia have larger manufacturing sectors and the losses were fairly comparable —between 14 and 19 percent.
Job growth since January 2010 varied as well. Employment edged lower in Virginia and West Virginia, down 1.3 and 2.7 percent, respectively, and was unchanged in the District of Columbia. In contrast, the auto and aerospace sectors have been significant drivers of growth in North Carolina and South Carolina in recent years. Manufacturing employment in both states has improved considerably as a result — up 6 and 16 percent, respectively — but still remains well below pre-recession levels.
Job loss in the construction sector was more severe in the southern part of the district. South Carolina experienced the largest decline in employment (33 percent) followed by North Carolina (27 percent). Losses in Maryland, the District of Columbia, and Virginia were also severe at 20, 22, and 22 percent, respectively. As indicated by the chart, outside of the District of Columbia where the multifamily construction market has been very strong, there has been a fairly lackluster recovery. Construction employment improved between 6 and 10 percent in Maryland, Virginia, and South Carolina and just 2 percent in North Carolina. The current level of employment in all of those states remains well below pre-recession levels.
Where there have been significant gains in employment in recent years has been in the service sector. The professional and business services industry, leisure and hospitality industry, and the education and health industry have each seen significant growth since 2010 with increases of 13, 14, and 17 percent, respectively. Notably, these industries all experienced more moderate employment declines (or no decline at all in the case of education and health) relative to other industries during the downturn. Professional and business services and leisure and hospitality declined 4.8 and 4.3 percent, respectively, while employment in education and health grew by 3.6 percent from January 2008 to January 2010. The decline in professional and business services ranged between 1 and 9 percent across Fifth District jurisdictions, while the decline in leisure and hospitality ranged between 2 and 6.7 percent, excluding the District of Columbia, where employment increased 3.3 percent. The increase since January 2010 in both sectors has been widespread across jurisdictions, with the exception of leisure and hospitality in West Virginia, where there has been only modest growth.
Have a question or comment about this article? We'd love to hear from you!
Views expressed are those of the authors and do not necessarily reflect those of the Federal Reserve Bank of Richmond or the Federal Reserve System.
Contact Us