Commuting Patterns around Virginia’s Biggest Cities
Regional Matters
October 19, 2016
Across many different measurements, commuting patterns in the Washington, D.C., metro area (that includes parts of Virginia in addition to the District of Columbia, parts of Maryland, and parts of West Virginia) look very different from patterns in other Virginia metro areas. Differences in mode of transportation are largely due to greater use of public transportation around D.C. Workers who live in the D.C. metro area are more likely to work outside their state of residence than workers in other Virginia metro areas. Travel times for workers in the D.C. metro area are also much longer than those in the Richmond or Virginia Beach MSAs, with much of this likely caused by traffic congestion around Washington. Estimates for these patterns come from the Census Bureau’s 2015 and 2014 American Community Survey.
Means of Transportation
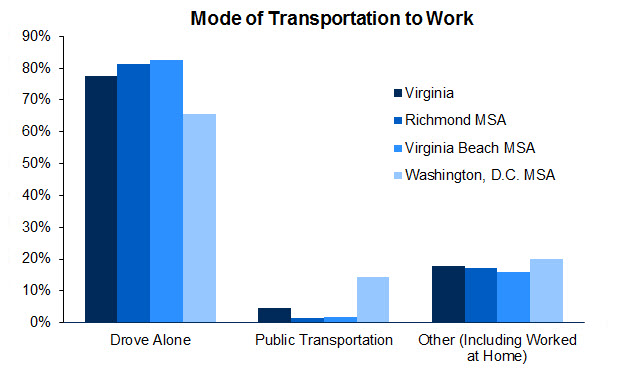
The methods of commute in the Richmond and Virginia Beach metro areas were very similar, with high shares of workers driving alone to work (81.2 percent and 82.5 percent, respectively), and low use of public transportation (1.5 percent and 1.7 percent). On the other hand, Washington, D.C., had a noticeably lower share of workers who drove alone at 65.7 percent. Most of this difference was due to increased use of public transportation in the D.C. metro area, with 14.4 percent of workers using public transportation. As shown in the chart below, other modes of transportation are relatively similar across the metro areas, though it is slightly more common to use alternative forms of transportation in D.C. than in other metro areas.
In addition to the larger share of public transportation in Washington, there was also a drastic difference in the type of public transportation used. Census estimates for 2014 (the latest year with detailed data on modes of public transportation) showed that only 38.7 percent of commuters using public transportation took buses in Washington, D.C., compared to over 94 percent in both Richmond and Virginia Beach. Instead, 55.6 percent of workers in D.C. took the subway.
Vehicles Available
The differences in mode of transportation can also be seen in the number of vehicles available to workers in a household. In the D.C. metro area, 5.9 percent of workers had no vehicle available, nearly double the percent reported in Richmond (3.0 percent) and in Virginia Beach (2.4 percent). However, more people in Washington, D.C., had only one vehicle available, at 23.2 percent, than either Virginia Beach or Richmond. Meanwhile, only 70.8 percent of workers in D.C. had two or more vehicles available, compared to 77.7 percent statewide.
Place of Work
Workers living in the D.C. metro area were much more likely to work in a different state than they live in, as shown in the chart below. They are over 10 times more likely to work outside their state of residence than workers living in Virginia Beach or Richmond. However this is not surprising considering that the Washington, D.C., MSA includes the District of Columbia, counties in Maryland and Virginia, and one county from West Virginia. On the other hand, the Richmond MSA is located completely in Virginia while the Virginia Beach metro area has only two counties outside Virginia (both in North Carolina). It is interesting to note that the share of workers who work in the same state and county of residence looks very similar across these MSAs, ranging from 46.7 percent in Richmond, to 51.4 percent in Virginia Beach.

Travel Time
Travel time to work was also much higher for workers in the Washington, D.C., metro area, with a median time of 34.4 minutes, nearly 10 minutes longer than Richmond or Virginia Beach (24.5 and 24.8 minutes, respectively). Additionally, in both Richmond and Virginia Beach, the most common commute times were 15 to 19 minutes and 20 to 24 minutes, whereas in the D.C. metro area, the two largest categories were 30 to 34 minutes and 60 or more minutes.
Have a question or comment about this article? We'd love to hear from you!
Views expressed are those of the authors and do not necessarily reflect those of the Federal Reserve Bank of Richmond or the Federal Reserve System.
Contact Us