A Fresh Look at Federal Contract Spending in the Fifth District
Many firms in the Fifth District and around the country rely heavily on federal government contracts. According to USAspending.gov, in fiscal year 2018, the federal government spent $545 billion on contracts in the United States. Of that, the Fifth District received about $129 billion, most of which was in the District of Columbia, Virginia, and Maryland. For Virginia and Maryland in particular, those contracts accounted for a significant portion of GDP at approximately 10 percent and 8 percent, respectively.
The data at USAspending.gov are publicly available and come from the Federal Procurement Data System (FPDS), which is the official record system of all federal procurements. Although the data are accurate and reliable, they have some characteristics that can make it challenging for analysts to study the data over time or by location. For example, FPDS records the full value of the contract in the year it was awarded, regardless of contract length. Additionally, FPDS data are recorded based on the location of the contract recipient; however, many businesses subcontract some or all of that work out to a business in another location. This means that businesses that actually receive the money and perform the work may be in a different city or state than where the contract was recorded.
It is possible, however, to adjust the FPDS data to account for those issues, which is exactly what Chmura Economics and Analytics does with their product, FedSpendTop. In this dataset, money is reallocated to the location of a subcontractor, where applicable, and contract amounts are divided evenly over the years for which the contract endures. While this is not perfect, as spending will not necessarily be divided equally from year to year, it allows for a better approximation of when the money is actually going to the listed business and entering the local economy. FedSpendTop also differentiates between Department of Defense (DOD) contracts and other federal contracts because DOD contracts account for a large portion of federal contract spending.
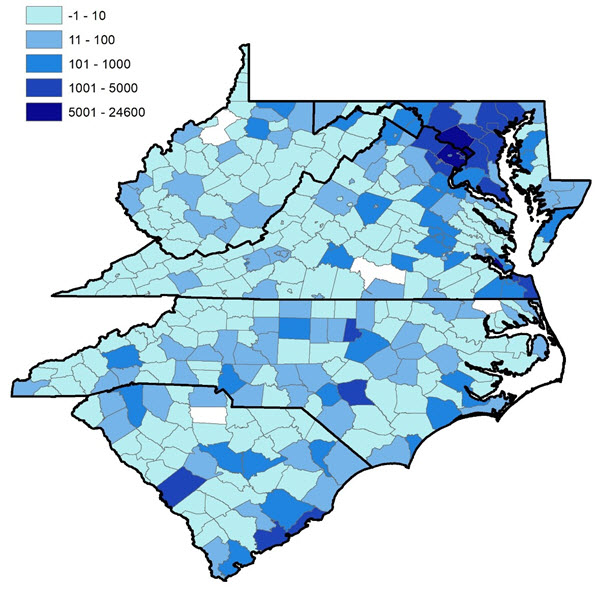
Using FedSpendTop data, total spending for the Fifth District in fiscal year 18 was $126 billion, compared with $129 billion using USAspending data. After adjusting the data for subcontracting, the highest federal contract spending in the Fifth District, both for defense and nondefense contracts, remained largely concentrated around the D.C. area. In fact, when aggregating the data by county, the top three were Fairfax County, Va. ($2.5 billion), the District of Columbia ($2.2 billion), and Montgomery County, Md. ($0.9 billion). See map below.
Since 2000, federal contract dollars in the Fifth District have largely been spent in D.C., Virginia, and Maryland. This is understandable because of high federal contract spending around the Washington, D.C., area, including parts of Maryland and Virginia. Meanwhile, the least amount of federal contract spending was in West Virginia, which accounted for less than 2 percent of total Fifth District federal contract spending in fiscal year 2018. About 10 percent of Fifth District contract dollars were in the Carolinas that same year, while 44 percent were in Virginia.
Federal contract spending increased in all Fifth District states and jurisdictions over the last 19 years. South Carolina has seen a good deal of volatility, but federal contracts were still more than 4.5 times higher in South Carolina in fiscal year 2018 than in 2000. The fastest growth occurred in Maryland, which had a 2018 level 5.7 times as large as its 2000 level. Despite the relatively low income from federal contracts, West Virginia still saw a great deal of growth in contracts over the past two decades, as spending was more than 5.6 times as high in fiscal year 2018 as in fiscal year 2000.
Federal spending on both defense-related and nondefense-related contracts in the Fifth District has risen significantly since 2000. Notably, spending on defense contracts began leveling off around 2009 and then dipped, although it started climbing again in 2017 and is now more than four times its 2000 level. Nondefense spending rose at a steadier rate than defense spending in the 2000s, and in fiscal year 2018, it was more than four times its 2000 level. Defense spending has been consistently above nondefense spending since 2000, but the two have begun to converge in recent years.
According to the FedSpendTop data, in fiscal year 2018, the professional, scientific, and technical services industry received the most federal contract dollars, accounting for about 53 percent of total federal contract spending in the Fifth District. The manufacturing industry received the second-most federal contract dollars at about 17 percent, which was largely driven by defense spending. In both those industries, spending remained largely concentrated in the Virginia-Maryland-D.C. area. However, the highest federal contract spending in the District of Columbia was for public administration services.
As federal contracts bring billions of dollars to the Fifth District each year, awareness of where and when federal contract work is occurring is vital to understanding the region’s economy. While USAspending.gov is a good source for this information, FedSpendTop provides useful information that cannot be gleaned from USAspending.gov, such as the locations of subcontracted work. FedSpendTop also distributes spending over time in a different manner, dividing spending over the years of the contract’s endurance rather than grouping it all in the initial year. Because of this, FedSpendTop data can help with analysis of the Fifth District economy in a new way.
Have a question or comment about this article? We'd love to hear from you!
Views expressed are those of the authors and do not necessarily reflect those of the Federal Reserve Bank of Richmond or the Federal Reserve System.


