2020 Census: A Look at the Fifth District
Regional Matters
December 16, 2021
Earlier this year, the U.S. Census Bureau released the first round of results for its 24th decennial census, giving an early look at population changes since the last census in 2010. At the national level, the population grew 7.4 percent between 2010 and 2020, the slowest growth rate since the 1930s in the aftermath of the Great Depression (7.3 percent). While some of the growth rate decline over the past decade may be explained by factors including the Great Recession, reduced immigration, and even data collection challenges during the pandemic, the slowdown also reflects longer-term trends — fewer births and more deaths as the population ages.
Beneath the overall population growth rate, substantial variation exists across states and between urban and rural areas. Metro areas with populations over 250,000 as of the previous census grew 9.2 percent, while smaller metro areas increased 5.2 percent. The population in nonmetro areas dropped by 0.6 percent. As previously discussed in the article “Rural Population Loss and Strategies for Recovery,” the population decline in rural areas raises several concerns for those communities, including a shrinking workforce and tax base. This post explores the latest census data to compare 2010-2020 population changes for Fifth District states and the rural and urban areas within them.
Variation at the State Level
Thirty-seven states in the nation, including all states in the Fifth District (excluding the District of Columbia), saw a slowdown in population growth over the past 10 years. Among these states were large differences in growth rates, ranging from an 18.4 percent increase in Utah to a 3.2 percent decrease in West Virginia. The total population in the Fifth District increased by 8.1 percent (about 2.5 million people). Three of the five states and the District of Columbia experienced percentage increases in population that were larger than the national growth rate. The District of Columbia saw the largest positive population change at 14.6 percent, followed by South Carolina (10.7 percent), North Carolina (9.5 percent), Virginia (7.9 percent), and Maryland (7 percent). West Virginia was one of three states nationally that experienced a population loss (-3.2 percent).
Rural and Urban Differences
Analyzing the data further at the county level reveals differences between rural and urban population changes. Using the U.S. Department of Agriculture’s 2013 Rural Urban-Continuum Codes (RUCC), which are based on the 2010 U.S. Census results, we can categorize counties across the rural-urban continuum. The codes range from 1 (counties in metro areas with at least 1 million residents) to 9 (counties with less than 2,500 urban population that are nonadjacent to metro areas). We classify RUCCs 1-2 as urban and 3-9 broadly as rural (See Map 1). It is important to note, however, that since RUCC codes are static and are due for an update in 2023, population changes between 2010 and 2020 may have pushed a county into a different RUCC code, even though that information won’t be officially confirmed for several years.
Sources: 2020 Decennial Census Redistricting File and USDA RUCC
Download data: Rural-Urban Continuum and 2020 Population Change in the Fifth District
| RUCC numeric code | Description |
| 1 | Metro - Counties in metro areas of 1 million population or more |
| 2 | Metro - Counties in metro areas of 250,000 to 1 million population |
| 3 | Metro - Counties in metro areas of fewer than 250,000 population |
| 4 | Nonmetro - Urban population of 20,000 or more, adjacent to a metro area |
| 5 | Nonmetro - Urban population of 20,000 or more, not adjacent to a metro area |
| 6 | Nonmetro - Urban population of 2,500 to 19,999, adjacent to a metro area |
| 7 | Nonmetro - Urban population of 2,500 to 19,999, not adjacent to a metro area |
| 8 | Nonmetro - Completely rural or less than 2,500 urban population, adjacent to a metro area |
| 9 | Nonmetro - Completely rural or less than 2,500 urban population, not adjacent to a metro area |
In 2010, 73.7 percent of people in the Fifth District lived in urban counties (RUCC 1-2). In 2020, that share increased to 76 percent. Conversely, the percentage of people living in rural classified areas (RUCC 3-9) in the district decreased from 26.3 percent to 24 percent (though this is still higher than the national percentage of 22.9 percent). In all Fifth District states, population growth was concentrated in urban areas, and in all states but Virginia, the rural population declined. (See table below.) If we more narrowly define rural to only nonmetro counties designated RUCC 4-9, the rural population change was negative for every state. West Virginia differs from the other states in the district because most of its population live in rural areas; there, the decline in its rural population exceeded the increase in its urban population, leading to an overall decrease in the state’s population.
| State | 2010 Total Population | 2020 Total Population | Level Change | Percent Change |
| District of Columbia | 601,723 | 689,545 | 87,822 | 14.6 |
|---|---|---|---|---|
| Urban | 601,723 | 689,545 | 87,822 | 14.6 |
| Maryland | 5,773,552 | 6,177,224 | 403,672 | 7.0 |
| Urban | 5,439,554 | 5,843,987 | 404,433 | 7.4 |
| Rural | 333,998 | 333,237 | -761 | -0.2 |
| North Carolina | 9,535,483 | 10,439,388 | 903,905 | 9.5 |
| Urban | 6,435,187 | 7,365,576 | 930,389 | 14.5 |
| Rural | 3,100,296 | 3,073,812 | -26,484 | -0.9 |
| South Carolina | 4,625,364 | 5,118,425 | 493,061 | 10.7 |
| Urban | 3,361,825 | 3,868,436 | 506,611 | 15.1 |
| Rural | 1,263,539 | 1,249,989 | -13,550 | -1.1 |
| Virginia | 8,001,024 | 8,631,393 | 630,369 | 7.9 |
| Urban | 6,183,549 | 6,796,552 | 613,003 | 9.9 |
| Rural | 1,817,475 | 1,834,841 | 17,366 | 1.0 |
| West Virginia | 1,852,994 | 1,793,716 | -59,278 | -3.2 |
| Urban | 373,673 | 391,012 | 17,339 | 4.6 |
| Rural | 1,479,321 | 1,402,704 | -76,617 | -5.2 |
| Fifth District | 30,390,140 | 32,849,691 | 2,459,551 | 8.1 |
| Urban | 22,395,511 | 24,955,108 | 2,559,597 | 11.4 |
| Rural | 7,994,629 | 7,894,583 | -100,046 | -1.3 |
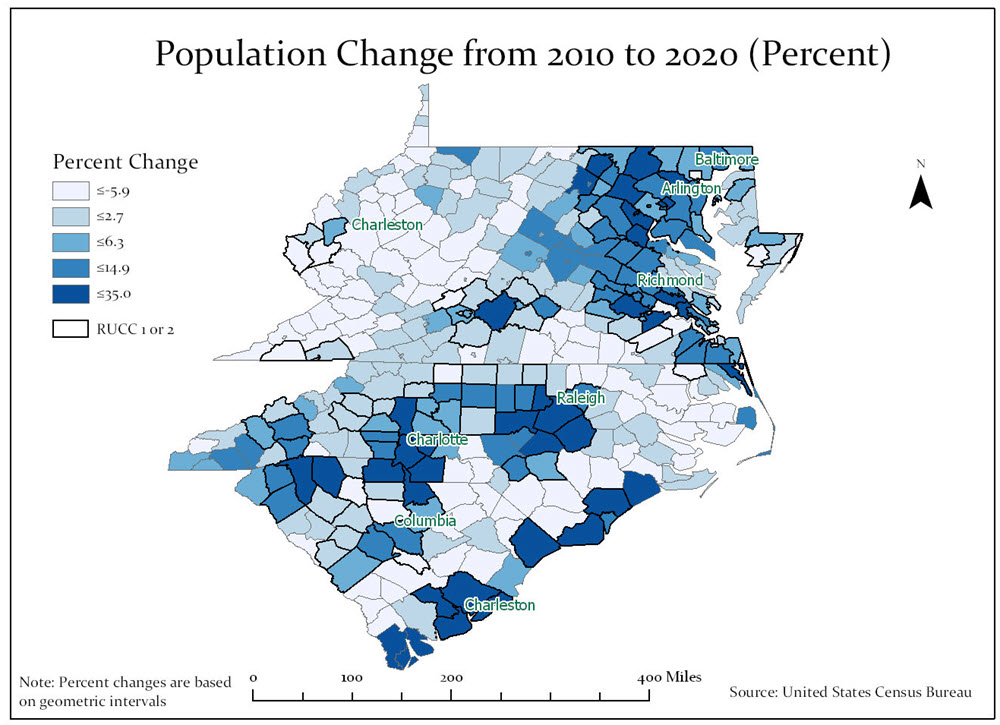
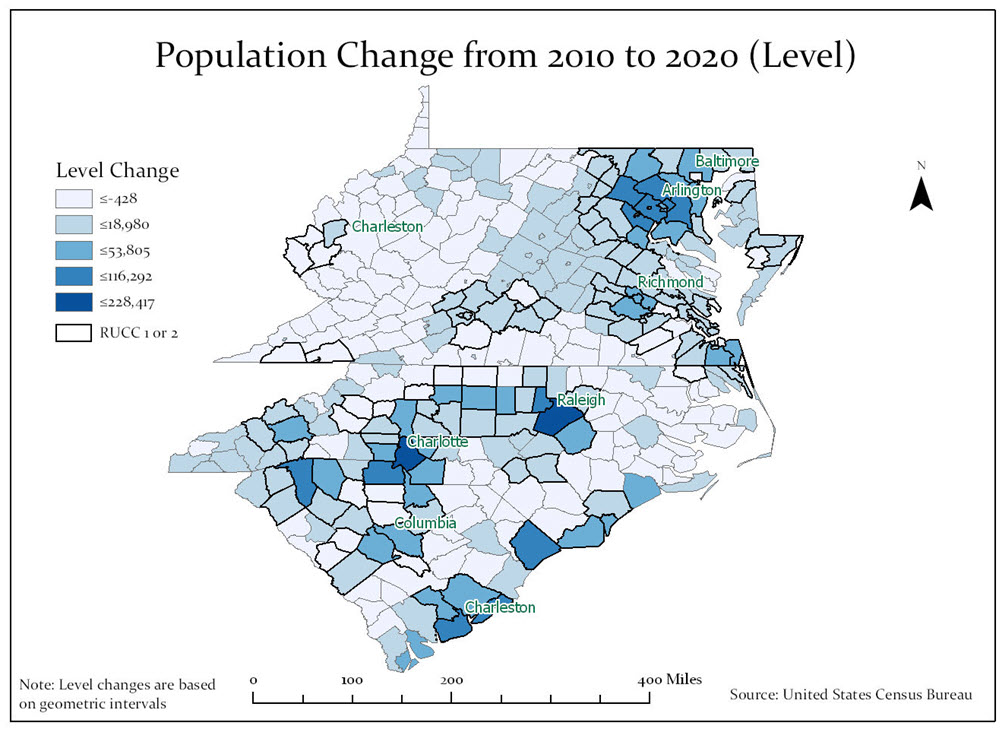
The two counties with the largest absolute increase in population were both urban RUCC 1 counties in North Carolina: Wake County, which includes the state capital city of Raleigh, and Mecklenburg County, home of Charlotte (increases of around 228,000 and 196,000, respectively). On a percentage change basis, Loudoun County in northern Virginia had the largest increase (34.8 percent). All of the top 10 counties with the greatest absolute increases and percentage increases in population were urban counties in the district (RUCC 1 or 2). Among counties in the district with population declines, Tyrrell County in North Carolina (RUCC 9 and the least populated county in the state) had the largest percentage decrease (-26.4 percent). However, the county with the largest absolute decrease was a RUCC 1 county. Baltimore City, a county-equivalent in Maryland, lost over 35,000 people (5.7 percent of its 2010 population). Still, of the other top 10 counties with the largest absolute and percentage decreases in population, all were rural.
When we consider proximity to urban areas, we see that rural areas near urban areas were less likely to have population declines compared to rural areas far away from urban areas. Overall, rural counties adjacent to urban areas had an average (unweighted) population decline of 2.6 percent, while nonadjacent counties had an average decline of 5.2 percent. In the maps below, the darker color counties experienced larger increases in population (level and percent), and the lighter color counties experienced smaller increases or negative changes in population. One example of a rural area near an urban area gaining population is Moore County, North Carolina, a RUCC 4 county that is home to Pinehurst. Moore County gained over 11,000 people or 13 percent since the last census. Still, there are many examples of adjacent counties that saw their population decrease. Robeson County, a RUCC 4 county near Fayetteville, North Carolina, lost over 17,000 people or more than 13 percent of its population.
What’s a Rural Area to Do?
The results of the 2020 U.S. Census continue to reflect longer-term trends of slowing population growth overall and a shift in population composition toward urban areas. Even with the long-term decline in rural populations, they remain a substantial portion of the Fifth District, and many rural communities and small towns are working to sustain themselves. Last month, the St. Louis Fed, in collaboration with the Federal Reserve Board of Governors, published the book Investing in Rural Prosperity, which outlines a framework for rural economic development and highlights success stories in communities across the country. At the Richmond Fed, we’re also spotlighting rural initiatives that we encounter in outreach and community engagement across our district. For more information, check out our Rural Spotlight series, where we delve into the people, organizations, and community-driven programs that are addressing challenges to improve economic outcomes.
Contact Us