

Application Accepted: Business Formation Boom Continues
Macro Minute
April 14, 2026
While several of our most recent posts have discussed risks to the economy — such as what market rents are indicating about the coming year — it's not all doom and gloom in the data. In January 2025, my colleague Chen Yeh investigated the pandemic-related surge in business applications, finding that it contributed to an increase in business establishment openings and job creation. However, available data at the time of Chen's analysis indicated the surge could be coming to an end. In this week's post, we look at the most recent data on business applications to assess prospects for business formation and employment growth.
The blue line in Figure 1 below shows the four-week moving average of business applications. In the beginning of 2025, applications dipped close to 80,000. Though this number is higher than prepandemic levels, it was notably below the levels observed in the preceding three years. However, over the course of 2025, business applications grew sharply, with the four-week moving average approaching 130,000 for the week ending Dec. 20. At the time of this writing, the latest moving average currently sits close to 110,000 for the week ending Feb. 28.
Figure 1 also shows the number of private sector establishment births in the orange line, with the most recent observation ending in the second quarter of 2025. This series has historically moved closely with the business applications series, indicating that the rise in business applications since early 2025 is likely to lead to the formation of new businesses.
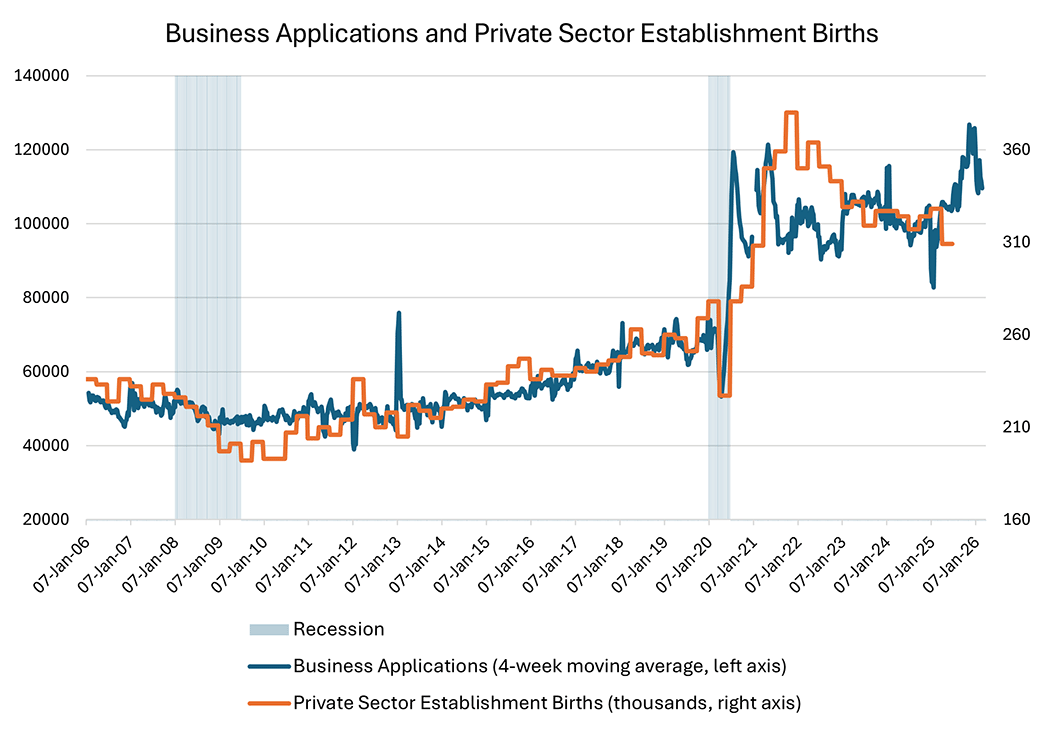
Table 1 below shows the industries that are seeing elevated applications for business startups, relative to the prepandemic decade. The top five industries in terms of growth in business applications are retail trade, professional services, construction, other services, and administrative and support.
| Industry name | Business Applications (latest month) | Business Applications (2010-2019 average) | Change |
|---|---|---|---|
| Retail trade | 76926 | 33515 | 43411 |
| Professional services | 74748 | 33700 | 41048 |
| Construction | 47959 | 24025 | 23934 |
| Other services | 42499 | 22482 | 20017 |
| Administrative and support | 36275 | 16754 | 19521 |
| Transportation and warehousing | 33371 | 14623 | 18748 |
| Health care and social assistance | 32102 | 15997 | 16105 |
| Accommodation and food services | 27903 | 13282 | 14621 |
| Unclassified | 14885 | 2195 | 12690 |
| Real estate | 26543 | 14162 | 12381 |
| Finance and insurance | 19974 | 12624 | 7350 |
| Arts and entertainment | 15434 | 8990 | 6444 |
| Information | 10974 | 5297 | 5677 |
| Management of companies | 6679 | 1593 | 5086 |
| Educational services | 8059 | 4175 | 3884 |
| Manufacturing | 7227 | 5144 | 2083 |
| Wholesale trade | 9532 | 8491 | 1041 |
| Agriculture | 4154 | 3180 | 974 |
| Utilities | 650 | 245 | 405 |
| Mining | 548 | 643 | -95 |
| Source: Census Bureau via Haver Analytics | |||
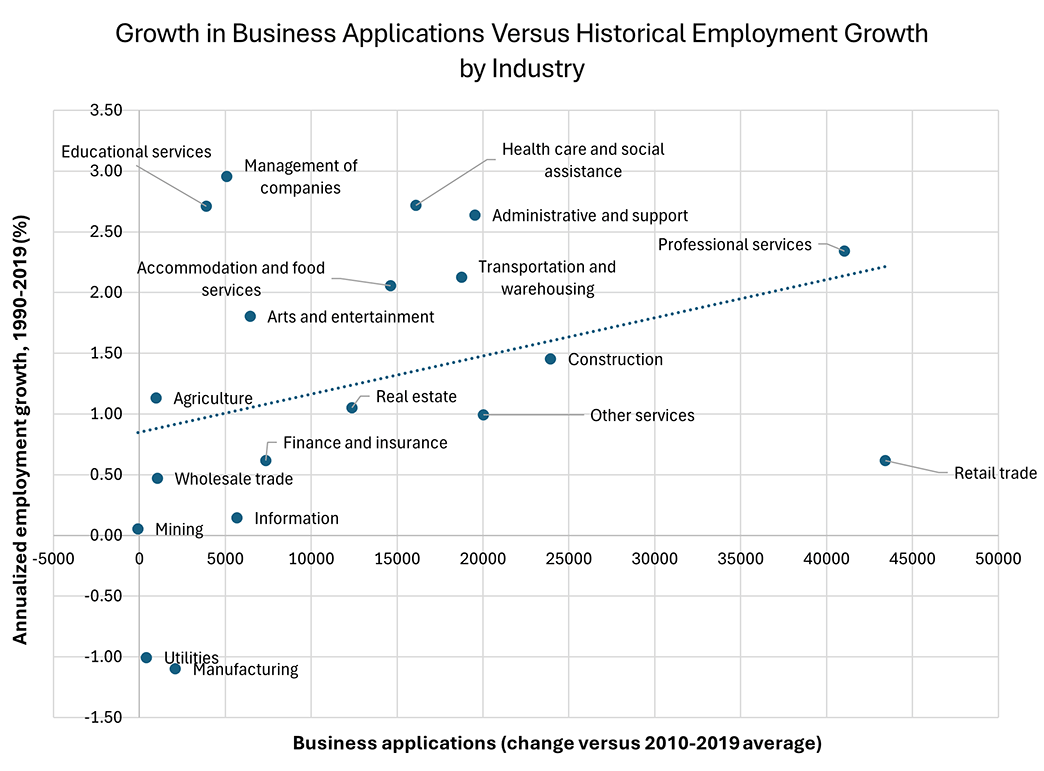
The mix of industries seeing rapid growth in business applications could bode well for job creation. Figure 2 below shows a positive association between the industries seeing the largest increase in business applications and industry-level historical job growth, as measured by the annualized change in employment between 1990 and 2019. Business formation in industries with stronger historical job growth could be a tailwind for future job creation, continuing the positive trend documented in Chen's 2025 article.
Views expressed in this article are those of the author and not necessarily those of the Federal Reserve Bank of Richmond or the Federal Reserve System.


Contact Us