What Market Rents Signal for Local Rent Conditions
Macro Minute
June 3, 2025
April's CPI inflation report was reassuring: The year-over-year change in headline CPI fell to 2.3 percent (the lowest since February 2021), and the year-over-year change in core CPI remained at 2.8 percent (the lowest since March 2021).
An important contributor to overall inflation is rent, which as of April accounted for 35 percent of the CPI basket. In the latest reading, the year-over-year change in rent CPI remained at the prior reading of 4.0 percent. However, the contribution of rents appears to be returning to prepandemic levels as presaged by a decline in growth in market rents. Figure 1 plots the year-over-year change in rent CPI versus the Zillow Observed Rent Index (ZORI), a measure of market rents. In a previous post, we discussed how market rent measures can lead the official rent index by roughly a year.
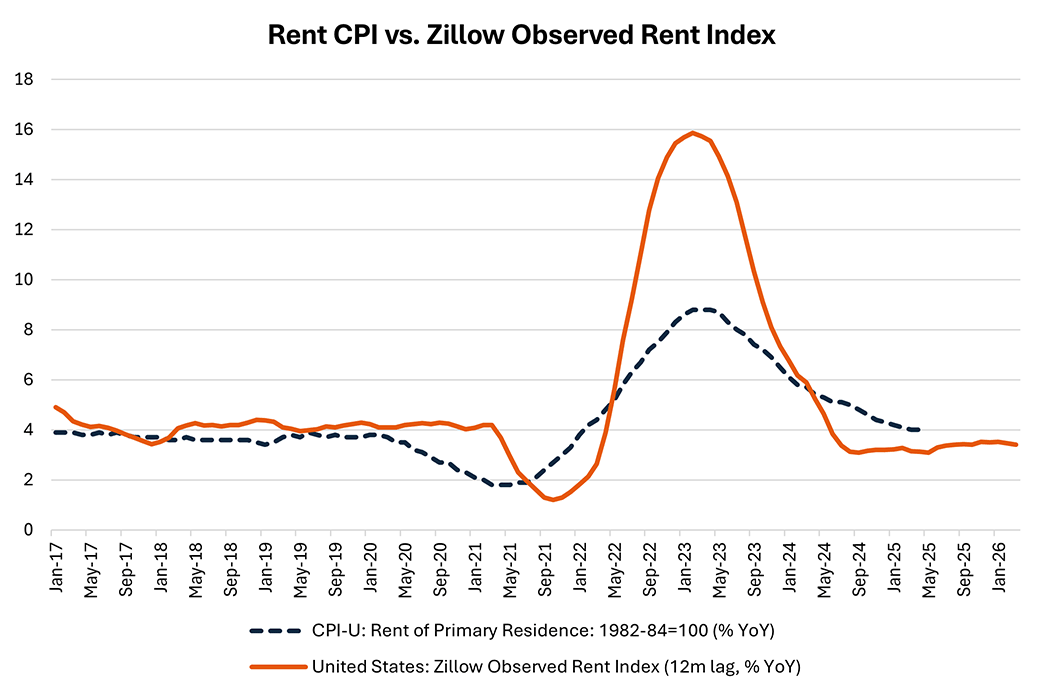
How is the slowdown in rent growth being experienced across the country? In this week's post, we look at what market rents (as measured by the ZORI) are signaling for rent growth in selected metropolitan areas.
The Bureau of Labor Statistics (BLS) publishes rent price indexes for selected metropolitan areas at a monthly frequency. Similarly, the ZORI is available at the city level, and it's also at a monthly frequency. Thus, these two datasets can be used to explore the relationship between market rents and official rent indexes at the city level. These disaggregated data give us additional information to test the ability of market rents in predicting official rent CPI indexes.
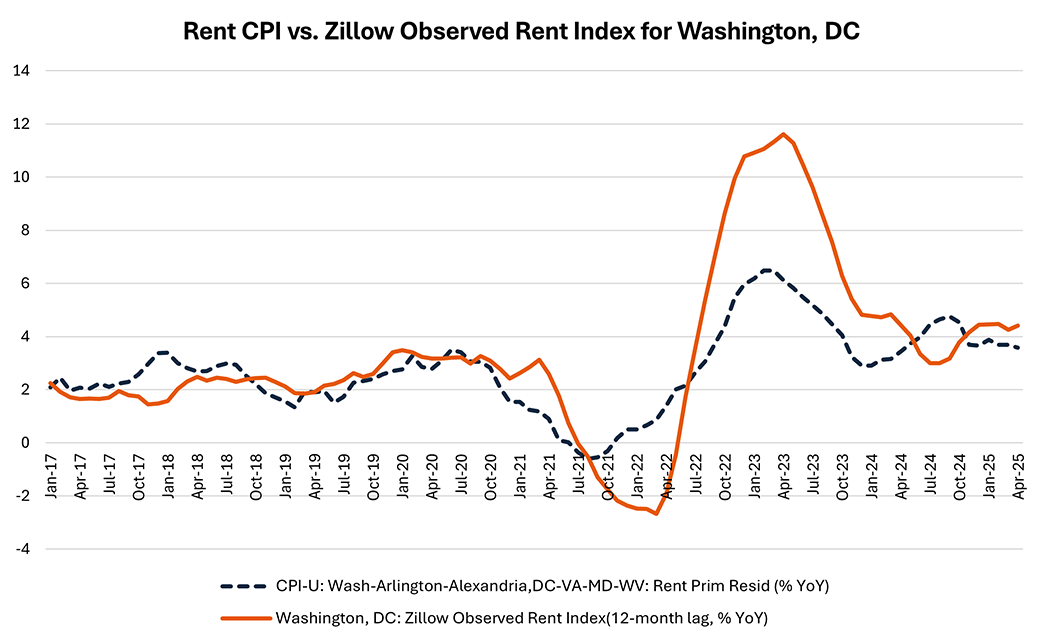
Figure 2 shows that the relationship between market rents and the BLS rent index for Washington, D.C., is similar to the relationship observed for the national index: Changes in local market rents lead changes in the local official rent index by about one year.
Looking across cities, there appears to be a tight link between year-over-year changes in official rent indexes and changes in the ZORI a year earlier. Figure 3 plots this relationship in February 2023, a month when the national rent CPI peaked at 8.8 percent year over year.
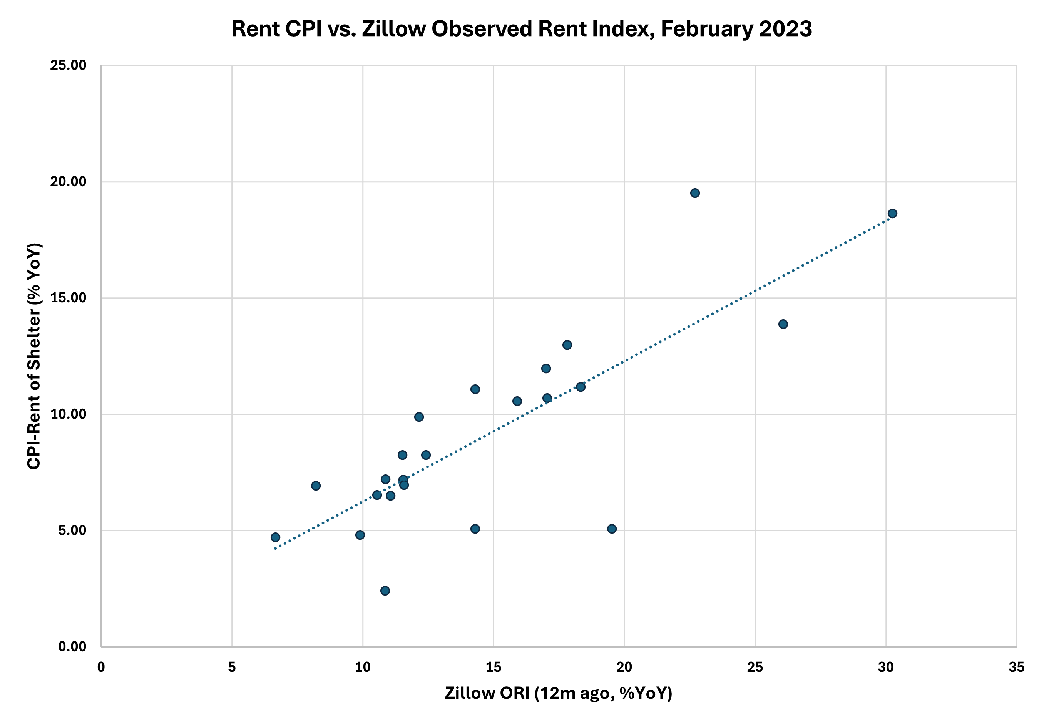
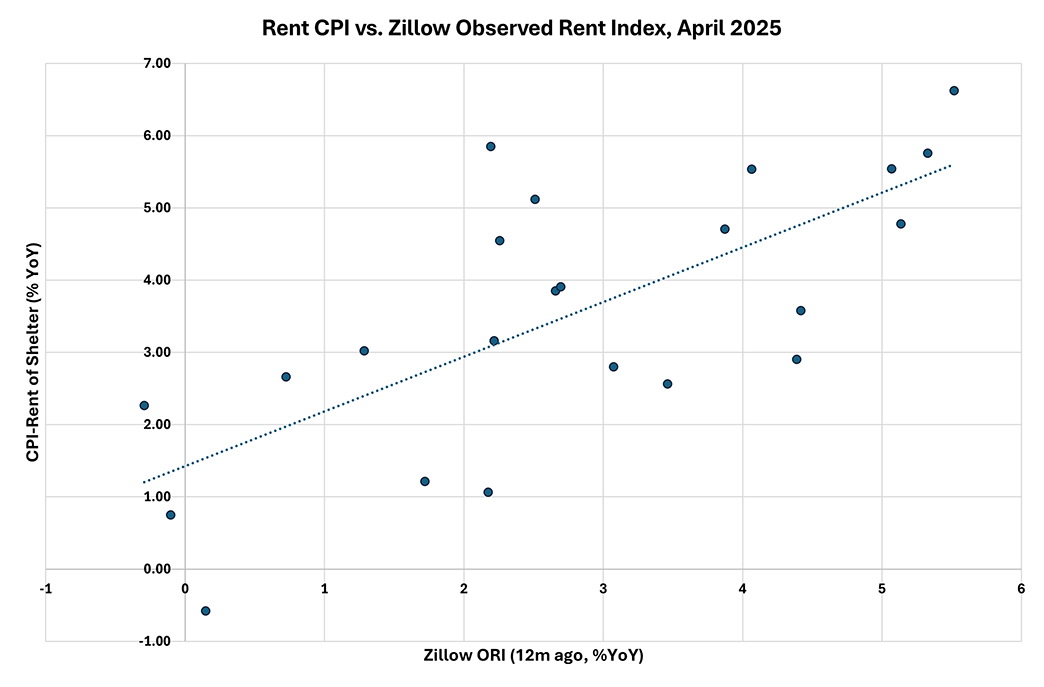
Figure 4 shows that the relationship between the two series can still be seen in the latest monthly data. Year-over-year changes in the ZORI in April 2024 are positively correlated with year-over-year changes in official MSA-level rent indexes in April 2025.
What do current ZORI readings indicate for the future path of rent inflation in these cities? Using the historical relationship between local official rent indexes and the 12-month lagged ZORI, we can use the latest April 2025 readings to forecast year-over-year official rent growth in April 2026.
Figure 5 displays forecasts for rent CPI growth, shown in arrows. There are two points for each city: The base of the arrow corresponds to the latest actual readings plotted in Figure 4, and the tip of the arrow corresponds to the level of rent inflation forecasted in April 2026, based on April 2025 ZORI readings. Green arrows represent cities where year-over-year rent inflation is forecasted to slow from current levels, and red arrows represent cities where year-over-year rent inflation is projected to increase.
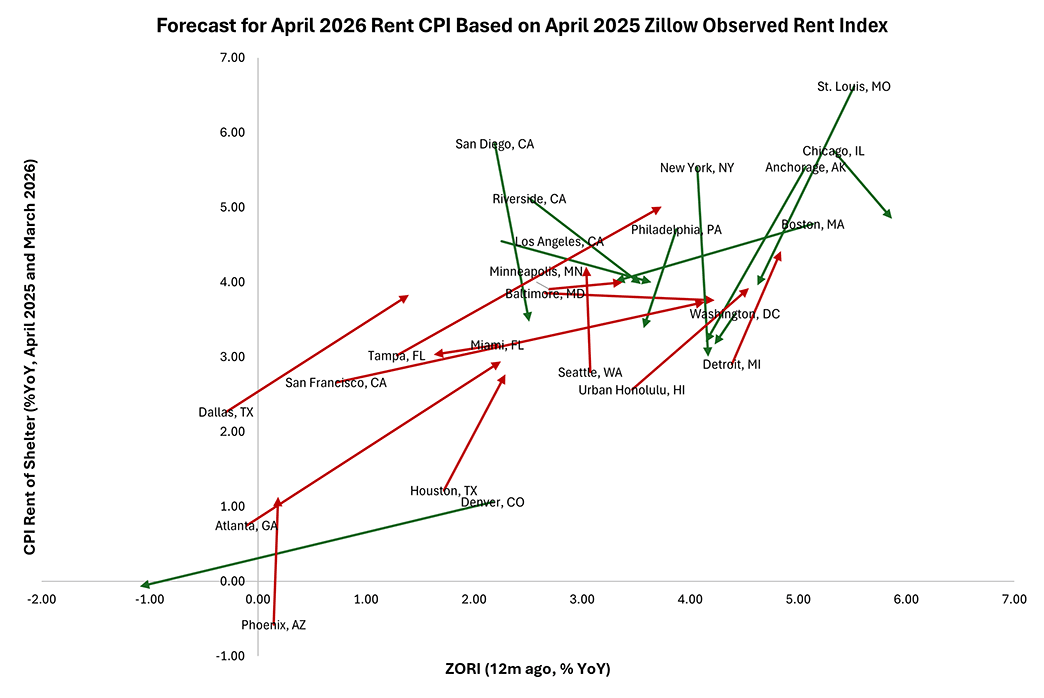
Figure 5 suggests that, based on local market rent patterns, the outlook for official rent inflation varies widely across the country. Cities that saw rent CPI growth greater than 5 percent year over year in April 2025 — such as New York, Chicago and San Diego — are likely to see rent growth slow further.
However, some official local rent indexes could be poised to accelerate heading into April 2026. In many cities currently experiencing moderate rates of rent growth — such as Dallas, Miami, Houston and Atlanta — rent CPI could rise more rapidly in April 2026. Denver is an exception to this pattern, with rent inflation projected to decline from 1.1 percent year over year in April 2025 to -0.1 percent year over year in April 2026. Underlying this projection, market rent growth in Denver as measured by the ZORI has already fallen from 2.2 percent in April 2024 to -1.1 percent in April 2025.
Looking at city-level data gives us more confidence in the hypothesis that current market rents can predict official rent indexes a year from now, with the relationship observed across several metro areas. The analysis reveals that rent conditions at the city level demonstrate a high degree of heterogeneity. However, these market-level differences across markets appear to result from normal variation and mean-reverting behavior: When aggregated to the national-level index shown in Figure 1, the net result is that overall aggregate rent growth has smoothly returned to prepandemic levels.
Views expressed in this article are those of the author and not necessarily those of the Federal Reserve Bank of Richmond or the Federal Reserve System.
Contact Us