When Will a Decline in Asking Rents Be Reflected in Rent CPI?
Macro Minute
April 04, 2023
When will a decline in market rents be reflected in official inflation measures? Indexes of market rents are currently showing a significant slowing versus their peaks in 2022, but the rent and owners' equivalent rent (OER) components of inflation continue to rise. Figure 1 below shows year-over-year growth in the personal consumption expenditures (PCE) index for rent versus the 12-month lead of two market rent indexes from Zillow and the Cleveland Fed. (Note that PCE uses imputed owners' rent instead of OER. The two concepts are quite similar, so we're going to use OER to mean both concepts in this blog post for simplicity's sake.)
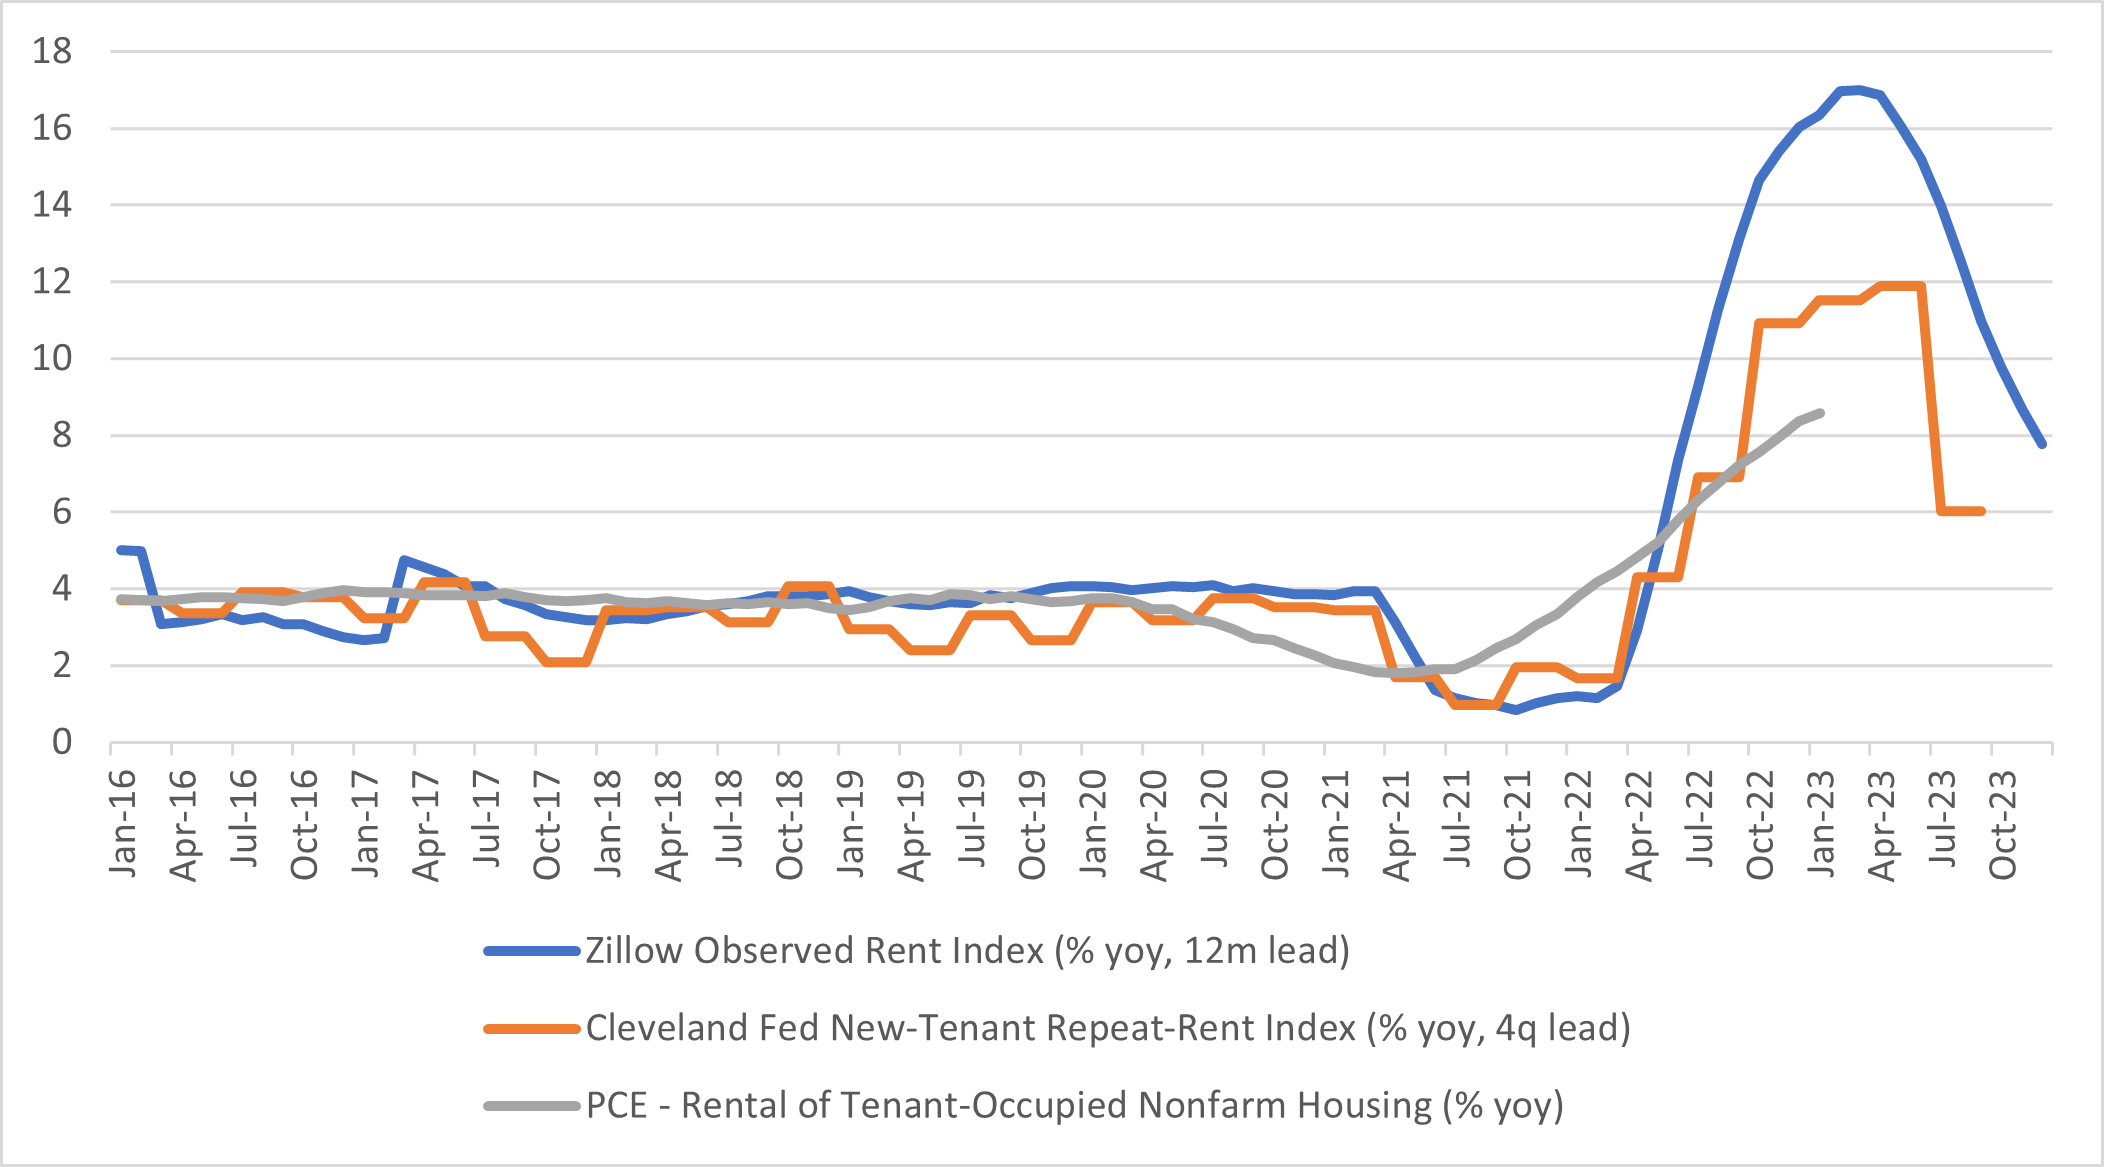
Over the past few years, several indexes have been created to provide more real-time analyses of rents. These indexes have been studied to see how changes in their measures correspond to changes in PCE or consumer price index (CPI) rents. According to the studies, these real-time indexes tend to lead more traditional measures of inflation by about a year, as seen in the table below.
| Table: Indexes of Rent Growth | |||
|---|---|---|---|
| RENT INDEX | ACRONYM | UNDERLYING DATA | RELATIONSHIP WITH OFFICIAL RENT MEASURES |
| REPEAT RENT INDEX | ACY 2015 | New contract rent transaction from Experian RentBureau, Jan 1998-Dec 2010 | Leads CPI rent by 2 to 4 quarters |
| MARGINAL RENT INDEX | ACY 2022 | Cap rates and property prices of large institutional-grade multifamily properties from Real Capital Analytics | Leads PCE rent index by 7 months |
| ZILLOW OBSERVED RENT INDEX | ZORI | Asking rents of Zillow-listed properties | Leads CPI for owners' equivalent rents by 12 months and CPI for tenant rents by 13 months |
| CORELOGIC SINGLE FAMILY RENT INDEX | SFRI | Monthly repeat transactions on single family rental homes listed in CoreLogic MLS | Leads CPI rent by 1 year |
| FEDERAL RESERVE BANK OF CLEVELAND NEW TENANTS REPEAT RENT INDEX | NTRR | BLS Housing Survey microdata on new rent contracts | Leads CPI rent by 4 quarters |
The improvement in data availability has allowed others to study the pass-through of current rental market conditions (as captured by asking rents and newly contracted rents) into official measures of shelter inflation. For example, the 2022 working paper "The Coming Rise in Residential Inflation" explores the relationship between the official residential inflation measures used in CPI and PCE and market rents as captured by the SFRI and ZORI. It finds that year-over-year growth rates in market rents have been powerful leading indicators for OER and rent inflation. In particular, year-over-year growth of OER inflation correlates most strongly with 12-month lags of private rents, while year-over-year growth of rent inflation correlates most strongly with 13-month lags of private rents.
The authors also develop a forecasting model, which predicts that OER inflation will peak in 2022 and remain elevated through 2023, with OER levels 5 percent higher on a year-over-year basis. They forecast rent inflation will be similarly elevated, ending 2023 at 6 percent year-over-year.
Such evidence suggests that the impact of the current slowdown in asking rents and newly contracted rents will manifest as slowing year-over-year growth of official rent price indexes over the course of next year. When will year-over-year growth in the rent and OER return to pre-pandemic levels?
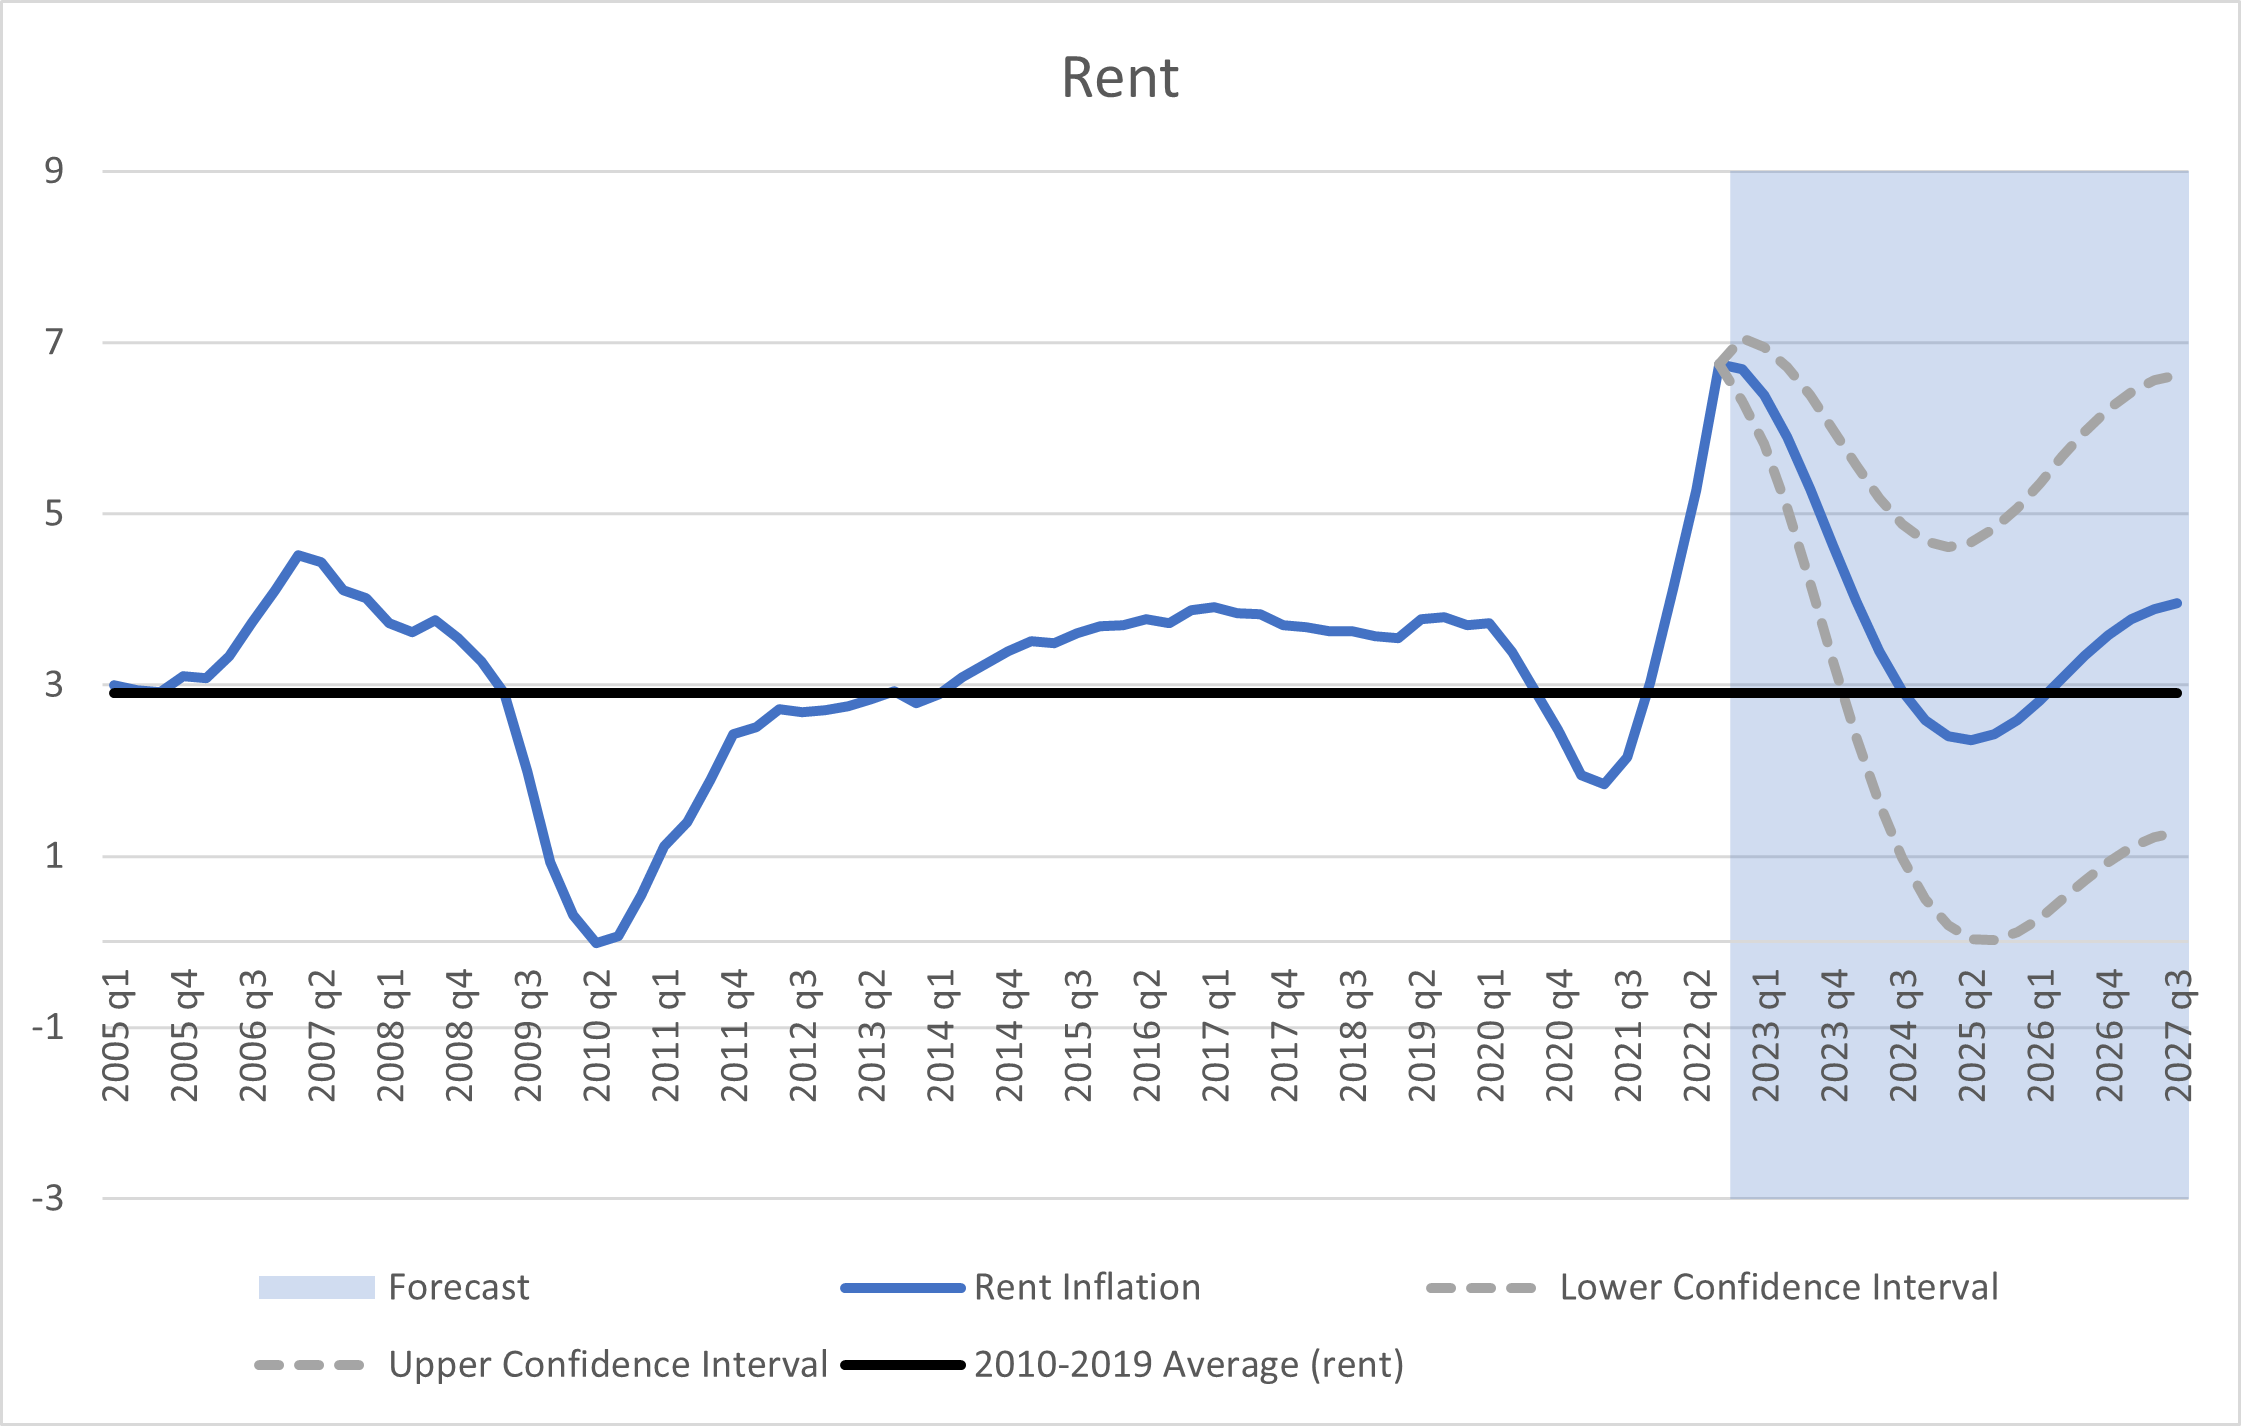
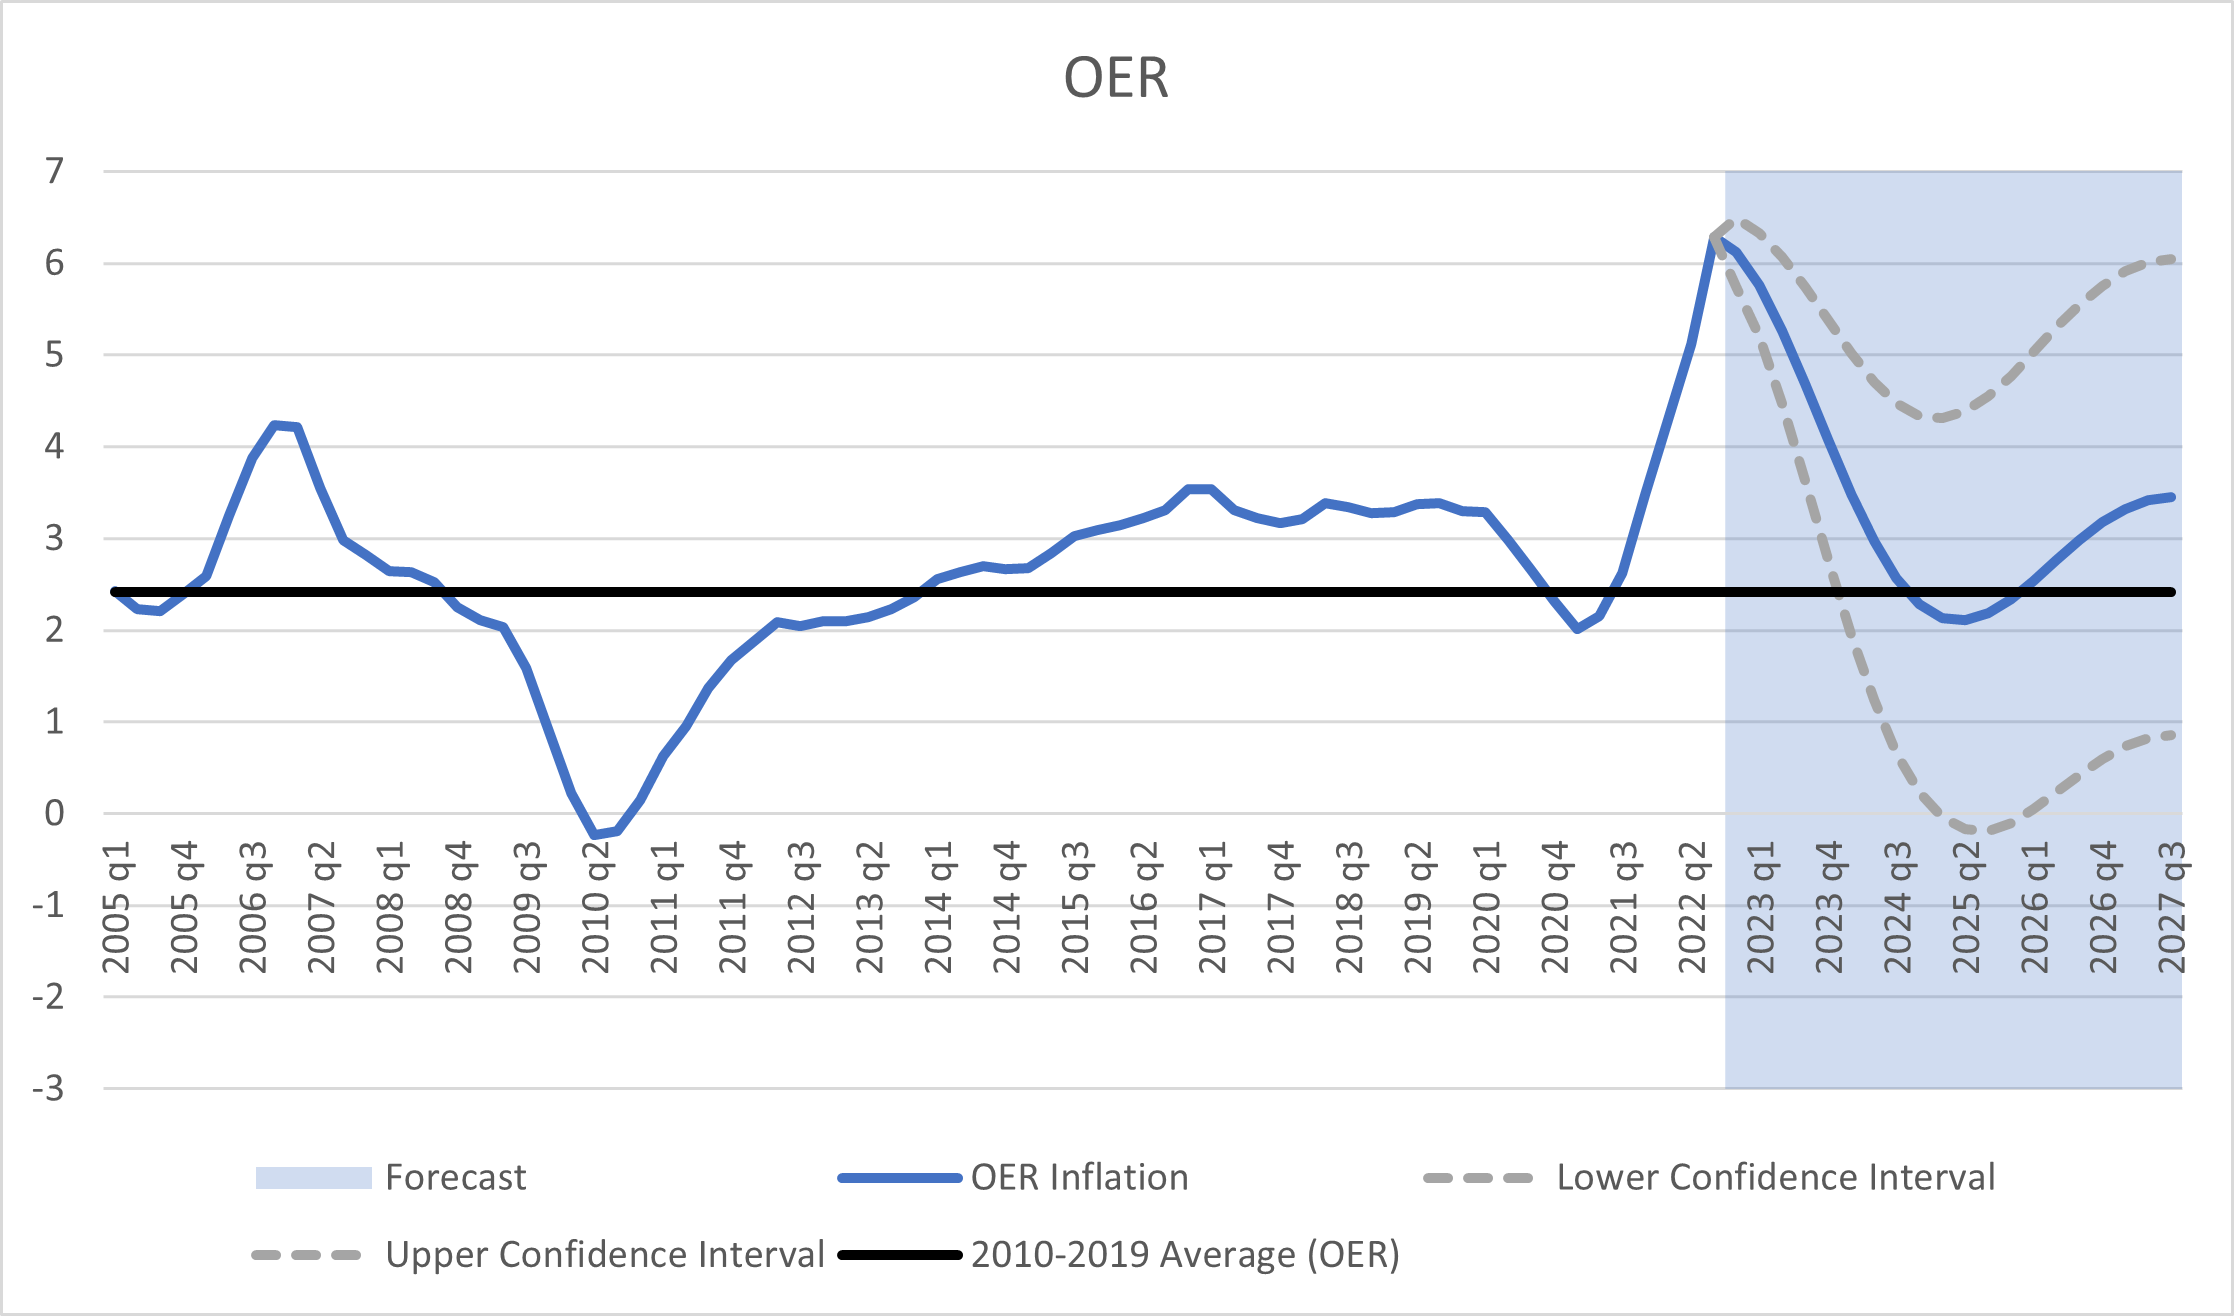
To answer this question, we conduct a simple forecasting exercise using a vector autoregression (VAR) model containing year-over-year percentage changes in the PCE price indexes for rent and OER, and the Cleveland Fed NTRR. Data are from the first quarter of 2005 through the third quarter of 2022. We used the estimated coefficients of the VAR model to iteratively generate forecasts for year-over-year rent price growth over a five-year forecast horizon.
The forecast for year-over-year growth in the PCE rent price index is shown below in Figure 2. Between 2010 and 2019, year-over-year growth in PCE rent averaged 2.9 percent per year. Based on current data and our estimated model, year-over-year growth of PCE rent will return to that pre-pandemic average in the third quarter of 2024.
The forecast for year-over-year growth in the PCE price index for OER is shown below in Figure 3. Between 2010 and 2019, year-over-year growth in the OER averaged 2.4 percent per year. Based on current data and our estimated model, year-over-year growth of the PCE price index for OER will return to that pre-pandemic average in the fourth quarter of 2024.
Our findings suggest that the shelter component of inflation will continue to impart upward pressure (relative to pre-pandemic norms) on 12-month headline and core PCE inflation beyond the end of 2023.
Views expressed in this article are those of the author and not necessarily those of the Federal Reserve Bank of Richmond or the Federal Reserve System.
Contact Us