Blown out of Proportion? Housing Prices, Home Prices and New Tenant Rents
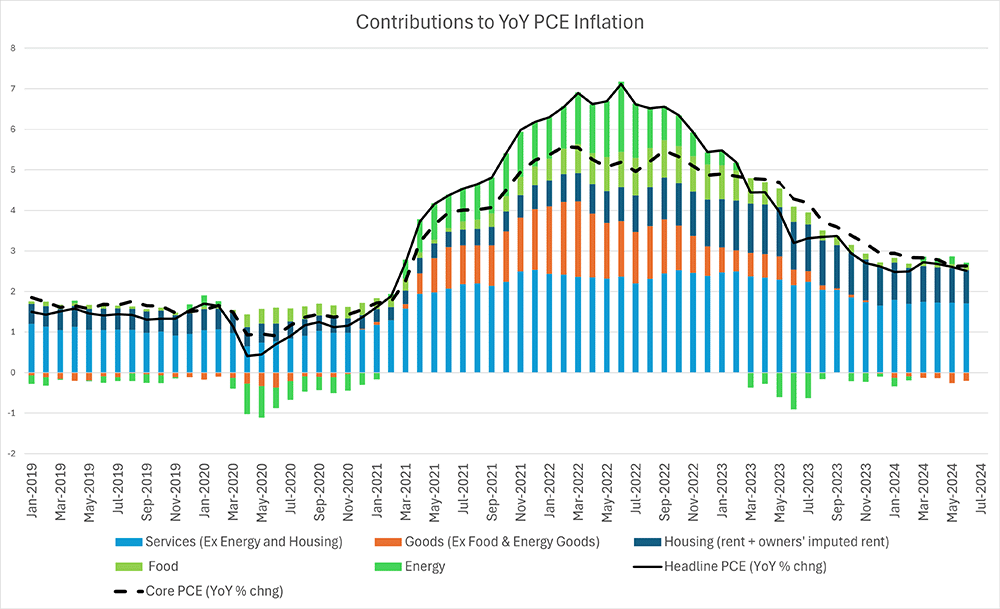
Housing services — which include tenants' rents and imputed homeowners' rents — continue to be a major contributor to inflation relative to the share of housing in personal consumption expenditure (PCE). As shown in Figure 1 below, rent and homeowners' imputed rents made up 33 percent of year-over-year PCE inflation in June, despite only accounting for 15.4 percent of the PCE spending basket. When considering the outlook for future housing services prices, economists have found it useful to examine the ratio of housing services prices to two other prices: home prices and rents for new tenants. In this week's post, we look at what these data might be indicating for the near-term outlook of housing services prices.
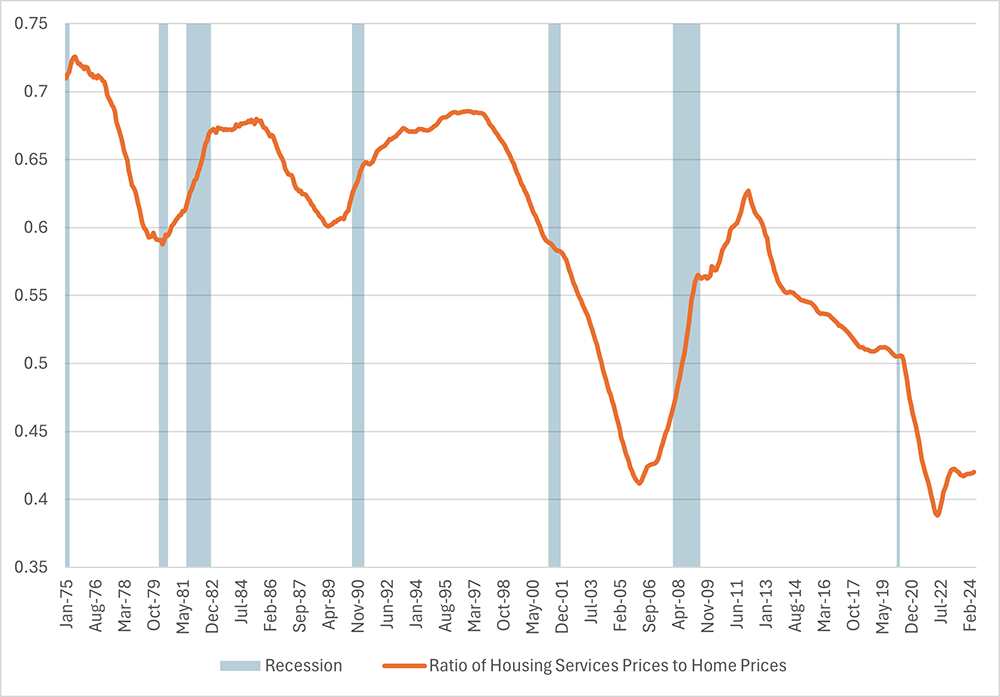
Figure 2 below plots the ratio of housing services prices to home prices as measured by the national S&P CoreLogic Case-Shiller Home Price Index (CSHPI). The ratio's May reading of 0.42 is low relative to its long-run 1975-2024 historical distribution: 1.9 standard deviations below the long-run average of 0.59. Assuming this ratio returns to its pre-pandemic level, the latest low readings potentially indicate further upside risk for housing services prices. If homebuying prices remain unchanged, tenant and homeowners' imputed rents would have to increase for this ratio to return to pre-pandemic levels.
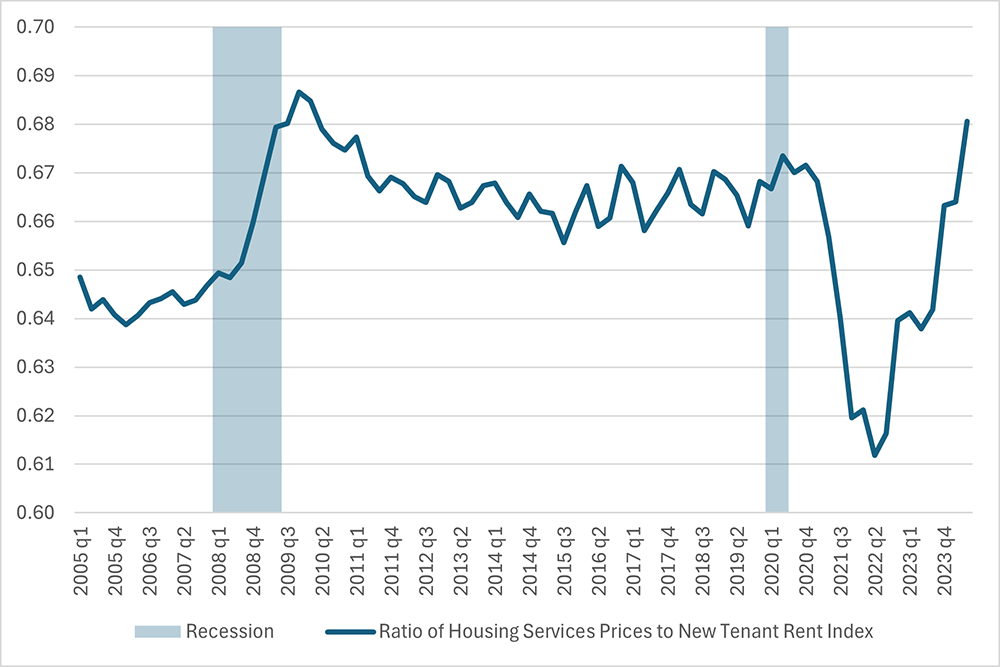
In contrast, examining the ratio of housing services prices to new tenant rents hints at a more optimistic outlook for housing services price growth. (Note: An earlier Macro Minute post discusses the relationship between new rents and the rent measures captured in official inflation indexes.) In the latest data from the second quarter of 2024, the ratio of housing services prices to the new tenant rent index (NTRI) was 0.68 compared to a pre-pandemic ratio of 0.67 and a long-run (since 2005) average of 0.66. Assuming mean-reversion in this ratio and adjustment on the part of the housing services price index, this suggests housing services prices could potentially fall in the near term — although the difference between the latest reading and the pre-pandemic benchmark is small.
When considering the overall balance of risks to the outlook, how does one decide between the upside risk to housing services prices noted in Figure 2 and the downside risk indicated in Figure 3? A key assumption we made in looking at both ratios was that both series tend to mean-revert. (In other words, they tend to return their long-run average over time.) We can judge which of the two ratios is more informative by testing whether they have demonstrated this property in the past.
One way to check a series for mean-reversion is to test whether the series is stationary (exhibiting a constant mean and variance over time), or non-stationary (not converging toward any particular level over time). Table 1 below reports the results of three statistical tests that evaluate whether a series exhibits non-stationarity. The Augmented Dickey-Fuller (ADF) and Phillips-Perron (PP) tests evaluate a null hypothesis that a series exhibits a kind of non-stationary behavior called a unit root. The Kiwatkowski-Phillips-Schmidt-Shin (KPSS) test evaluates the null hypothesis that a series is stationary.
| Ratio of housing services prices to CSHPI | Ratio of housing services prices to NTRI | |
|---|---|---|
| ADF test | Unable to reject unit root hypothesis (p = 0.23). | Reject unit root hypothesis (p = 0.04). |
| PP test | Unable to reject unit root hypothesis (p = 0.88) | Unable to reject unit root hypothesis (p = 0.50) |
| KPSS test | Reject stationarity hypothesis (p < 0.01). | Unable to reject stationarity hypothesis (p > 0.10). |
| Source: Author's calculations | ||
Table 1 shows that all three tests suggest that the ratio of housing services prices to the CSHPI is non-stationary and therefore does not exhibit mean-reverting behavior. In contrast, two of the three tests suggest the ratio of housing services prices to the NTRI may be stationary. Based on these results, economic forecasters might want to put more emphasis on the latter ratio when forming an outlook for housing services prices.
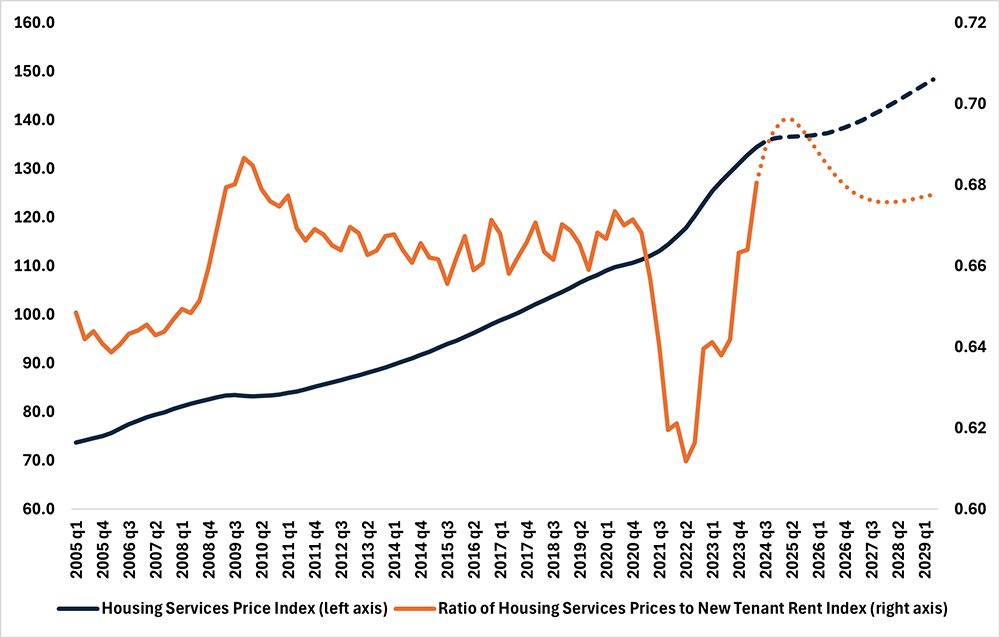
The challenge in dealing with ratios is that mean-reversion could be driven by either the numerator or the denominator. To identify which of the two price indexes is likely to be doing the adjustment, I estimate an error correction model for both series and use it to construct a five-year forecast. (Note: The model is described in greater detail in an earlier post that looks at the relationship between the CPI and the PPI.) The forecast is plotted below in Figure 4.
The model forecasts that the process of mean-reversion in the ratio could be delayed, with the ratio of housing services prices to NTRI rising through the middle of 2025. The model also projects that the housing services price index will stall in the near term before resuming an upward trajectory similar to its pre-pandemic pace. This indicates that the projected near-term increase in the ratio is driven by declines in the NTRI through mid-2025. Thereafter, the ratio of housing services prices to NTRI is projected to decline toward its long-run average as NTRI growth outpaces growth in housing services prices.
These results show the trickiness of forecasting based on a narrative of mean-reversion in ratios: The process of mean-reversion doesn't always kick in immediately, and adjustments in ratios depend on the interplay of the numerator and the denominator.
Views expressed in this article are those of the author and not necessarily those of the Federal Reserve Bank of Richmond or the Federal Reserve System.


