

Retail Resilience Defies Doomsayers
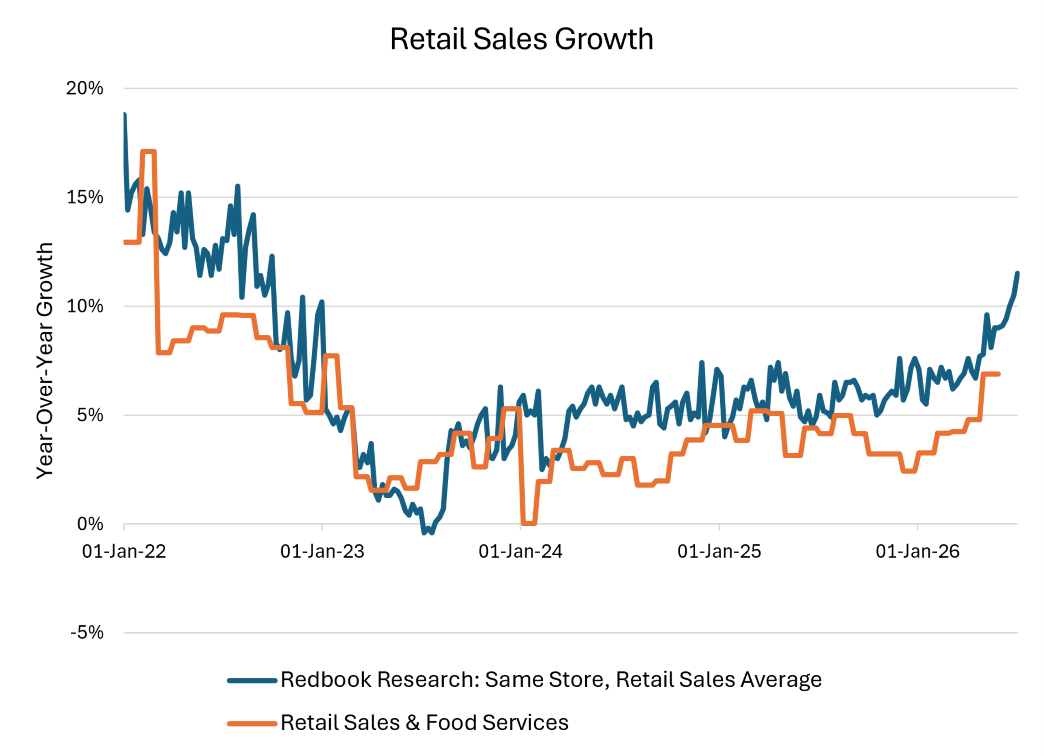
The latest retail sales data suggest that both consumer spending and the retail sector remain robust. As shown in Figure 1, retail and food services sales as measured by the Census Bureau were up 6.9 percent year over year as of May. Furthermore, a weekly same-store retail sales metric published by Redbook Research — a leading indicator for the official Census measure — increased for the sixth consecutive week, reaching 11.5 percent year over year the week ending July 4. This is its highest reading since 2022 and an indicator of further near-term strength.
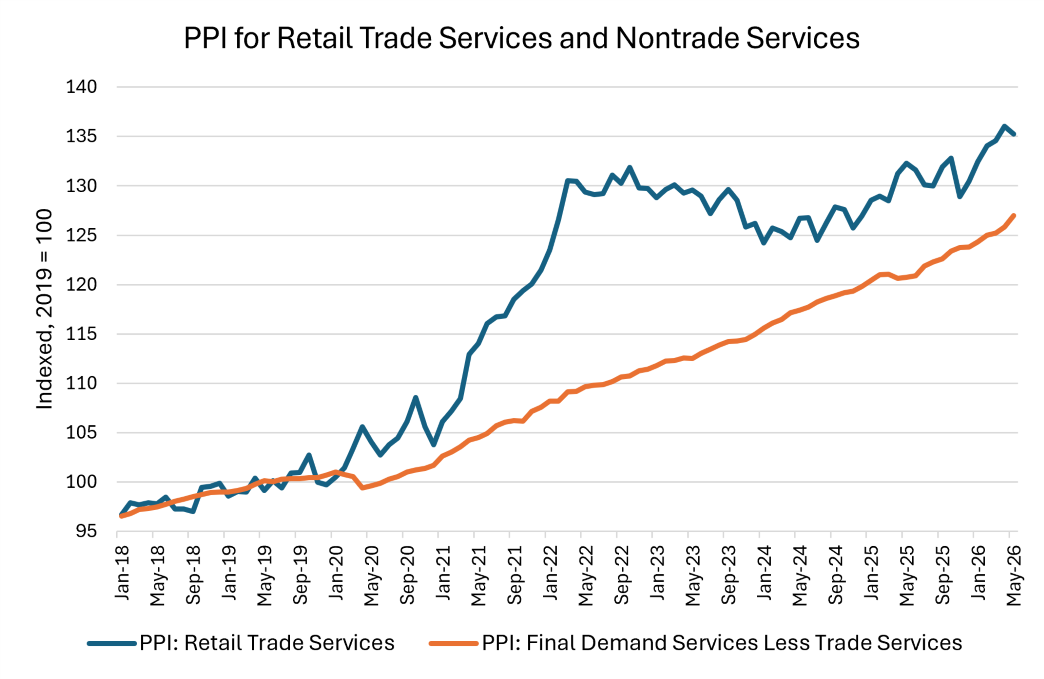
While rapid nominal sales growth may not necessarily translate to booms for retailers if their costs are also ballooning, some data indicate that retailers have been able to more than keep up with rising costs. For example, Figure 2 shows that the retail trade services producer price index (PPI) has risen rapidly since the pandemic, with an increase larger than the increase observed in the PPI for nontrade services. This price index — which we've previously covered — measures the average difference between retail businesses' selling prices and their acquisition prices, with increases indicating a larger gap between selling and acquisition prices.
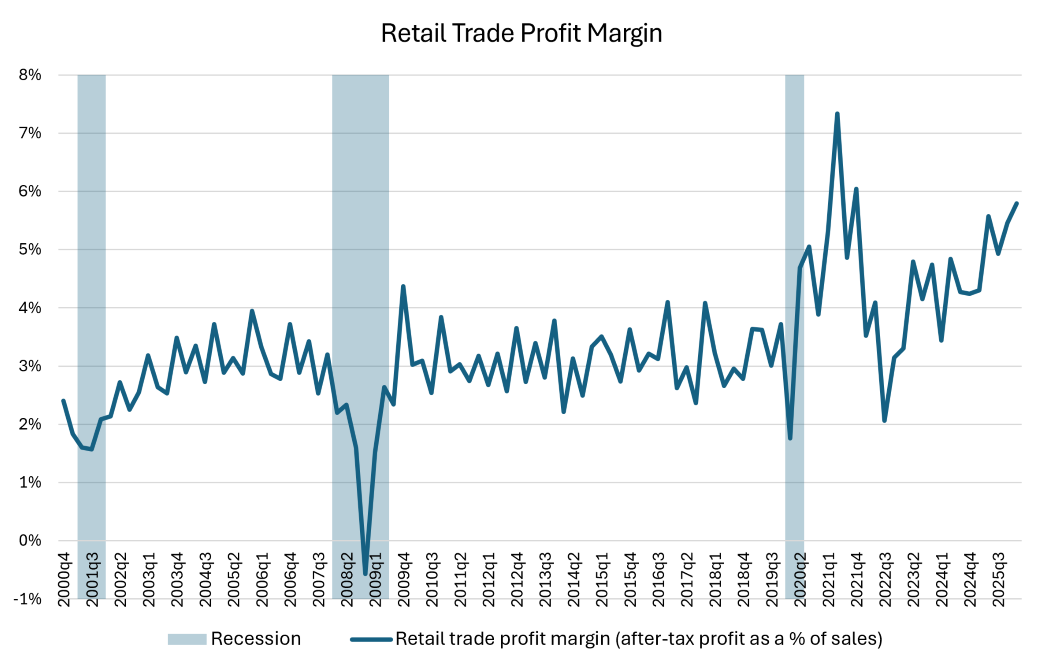
Additional data from the Census Bureau's Quarterly Financial Report reveal that retail businesses have been achieving healthy profit margins. Figure 3 plots the retail trade profit margin, which is computed as retailers' after-tax profits as a percentage of sales. Retail profit margins rose to 5.8 percent in the first quarter of 2026, which was the highest share seen in data (outside of the pandemic) starting in the fourth quarter of 2000.
These positive developments show that retail businesses and U.S. consumer spending have kicked off summer in full stride, assuaging concerns of a near-term consumer pullback.
Views expressed in this article are those of the author and not necessarily those of the Federal Reserve Bank of Richmond or the Federal Reserve System.


