High-Frequency Indexes Excel in Times of Extreme Uncertainty
Economic Brief
January 2021, No. 21-01
In rapidly evolving crises, such as the COVID-19 pandemic, indexes of financial conditions based on high-frequency data give policymakers more timely information than better-known monthly or quarterly indicators. This Economic Brief discusses four high-frequency (daily or weekly) indexes that have become much more important in the past nine months.
The arrival of COVID-19 plunged the U.S. economy into a period of great uncertainty. As the virus spread, government officials struggled to find appropriate social and economic policy responses, while financial conditions seemed to change overnight. Many of the established, well-known indicators used to gauge economic conditions — such as unemployment, retail sales and GDP — were unable to keep up. The data driving these indicators, usually lagging one or more periods behind real time, were becoming stale even before their release.
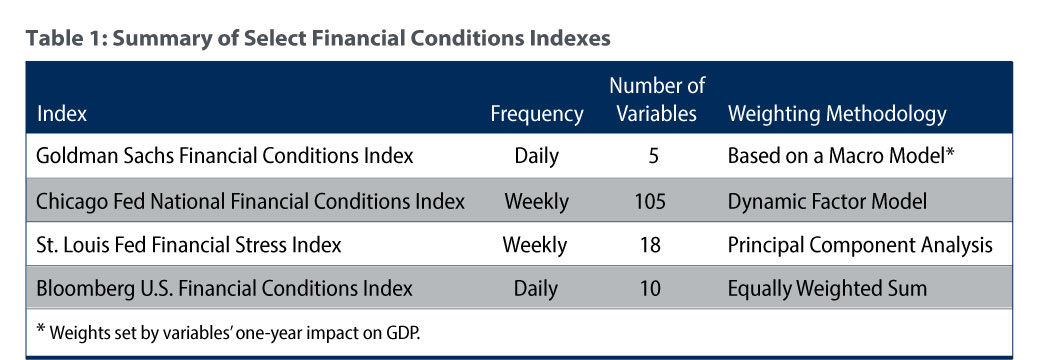
In such rapidly evolving and uncertain times, higher-frequency data series are particularly helpful to more accurately assess economic conditions.1 One key to understanding the evolution of general economic conditions is assessing the level of tension in the financial sector. Since financial conditions influence borrowing terms for businesses and households, they have a noticeable effect on economic conditions. Table 1 provides an overview of four high-frequency indexes that attempt to measure such financial conditions.2
Constructing Financial Conditions Indexes
In general, a financial conditions index (FCI) is a composite of variables designed to provide a comprehensive indicator of financial system tension. The number of individual variables used can range from fewer than 10 to more than 100. Typically, economists construct an FCI as a weighted sum of variables. The results presented by indexes constructed using this methodology hinge on the specific weights given to each index component. The weight given to a component can be thought of as its importance when it comes to describing financial conditions.
In an equally weighted index, each component has the same influence on the index value, implying that each component has equal influence on overall financial conditions. The Bloomberg index (BUSFCI) is an example of an equally weighted index. In an unequally weighted index, the weight given to each component can be computed using a structural or statistical model. When using a structural model, the general interpretation for the weight given to a component is the magnitude of the effect, relative to the other variables, a standard change in the variable would have on GDP or some other macroeconomic measure. The Goldman Sachs index (GSFCI), which uses a structural model to calculate weights, is a good example of how macro models can generate unequal weighting. Just two variables in the GSFCI — the corporate credit spread and the long-term risk-free bond rate — comprise 85 percent of the total index.
Component weights calculated using statistical models are commonly derived by factor models. Factor models, also called dimension reduction models, are a class of statistical models that condense a large number of variables into a few highly informative components while maintaining the variation found within the initial dataset. Typically, this is accomplished by extracting one or more common components from the original variables. These common components represent the largest shared sources of variation among the variables. The common components are then used as weights to construct the new dataset. When constructing an index, only the most informative common component is extracted and used to generate the new variable, the index itself in this case. The component weight typically represents the change to the index — measured in standard deviations — that a one standard deviation change in the component generates. The St. Louis Fed index (STLFSI) and Chicago Fed index (NFCI) are examples of indexes constructed using factor models.
Interpreting FCIs
A common way to consider financial conditions is to look at how "tight" financial markets are. In general, tighter financial markets are defined as having higher interest rates, while the converse is true for accommodative financial markets. For most FCIs, and for all of them (except the BUSFCI) discussed here, a value greater than the baseline value indicates tighter financial conditions, and a value less than the baseline indicates more accommodative financial conditions. (See Figure 1.)
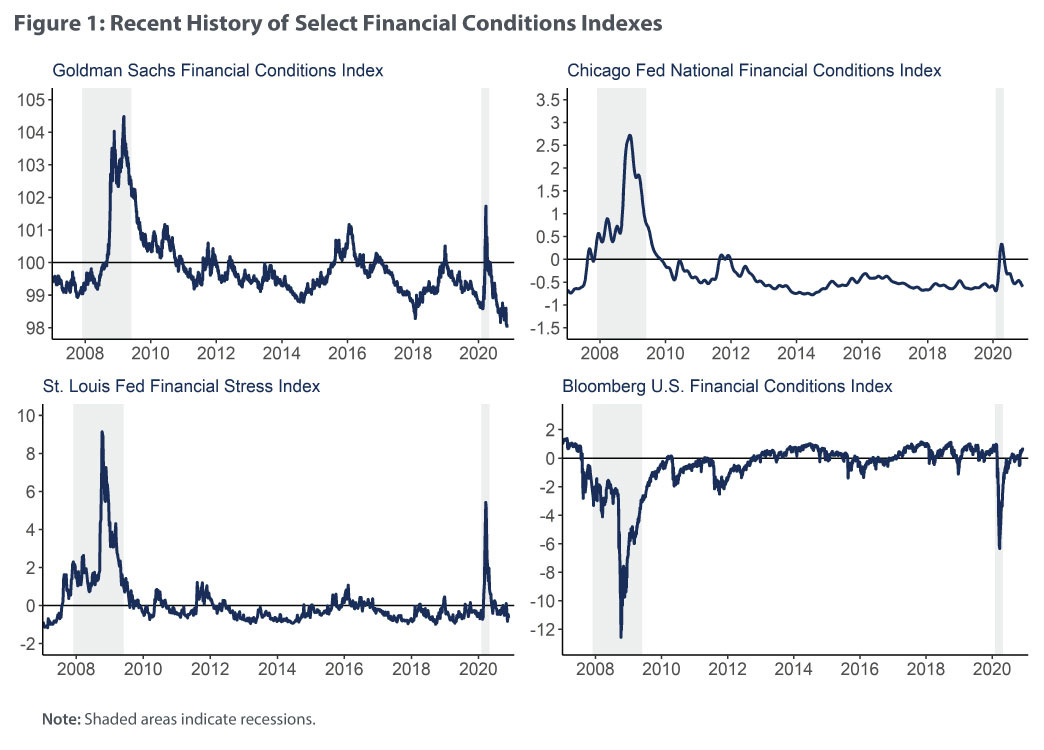
The BUSFCI is almost a mirror image of the other three indexes because its tighter conditions are expressed as negative values. Typically, FCIs are conveyed in terms of z-scores, a statistical tool that expresses the number of standard deviations a value is above or below an average value. In other words, the current level of the index minus the baseline level indicates the number of standard deviations between current conditions and baseline conditions. The specific baseline value of each index varies, but the value typically represents average conditions on either a specific date or over a specific period. For example, a value of two in the NFCI shows that current conditions are two standard deviations tighter than baseline conditions.
The four FCIs in Figure 1 tell similar stories about the onset of the COVID-19 pandemic in the United States. Around March 2020, there was a sudden transition from fairly accommodative conditions to levels of financial tightness not seen since the 2008 financial crisis. Almost as suddenly, conditions returned to their pre-March levels.
Beyond that significant similarity, each index tells a slightly different story. The Chicago NFCI shows that prior to March 2020, there had been a prolonged period of accommodative conditions and that the financial tightness experienced in March was significantly less intense than the financial tightness experienced in 2008. In contrast, the GSFCI indicates that there had been a few financially tight episodes since 2008. For example, early 2019 — a period defined by growing U.S.-China trade tension — produced a substantial spike. The GSFCI also indicates that conditions in March were a little less than half as tight as those experienced in 2008. The STLFSI presents a more pessimistic view: It indicates that March conditions were closer to 60 percent as tight as they were in 2008, the tightest (in relation to 2008) of the four indexes in Figure 1. The STLFSI also indicates that prior to March 2020, there had been a relatively stable period (2012–20) defined by financial conditions remaining near baseline levels of tightness, a trend echoed by the BUSFCI.
Advantages and Disadvantages of FCI Methods
There are many reasons why FCIs produce different results. Examples include method of construction, choice of variables and selection of a baseline period.
The specific methodology used to generate each index can vary greatly. The construction methodology also influences the best uses for each index. For example, the principal components analysis (PCA) method used to build the STLFSI requires the same frequency and full time series of all variables used. While this approach can limit researchers' ability to look at historical values of the index many decades ago, it should bolster confidence in comparing numbers in more recent decades. In contrast, the Chicago NFCI is constructed using a dynamic factor model (DFM). Dynamic factor models are similar to PCA models but allow for much more flexibility when it comes to variable frequency and duration. By using a DFM, economists are free to mix weekly, monthly and quarterly data. Without the requirement for full time series and consistent frequency, researchers can use a wider variety of variables in the index and look at historical data stretching back much further.
While this added flexibility provides the ability to calculate index values many decades in the past, users of the index should be careful when comparing those numbers to current readings. Dynamic factor models can stretch far back because they ignore all missing variables and calculate the index using only available data, a choice that could have an impact on the specific meaning of historical values of the index. In the case of the Chicago NFCI, only 25 percent of its variables were available in 1973, when the index started, and only 50 percent of its variables were available in 1987.
Recalculating with New Data
It is also important to keep in mind that researchers recalculate some FCIs every time new data or revised data become available. This is generally the case for any index constructed using either a statistical or structural model, and the inclusion of new or revised data can significantly affect an index and its comparability to other indexes across time. For example, the Chicago NFCI calculated with data through June 24, 2020, (the red line in Figure 2) indicates that conditions in March were no tighter than baseline conditions. However, when calculated using data through Dec. 2, 2020 (the blue line), a different picture emerges: Conditions during the peak of the pandemic appear to be roughly half a standard deviation tighter than baseline conditions.
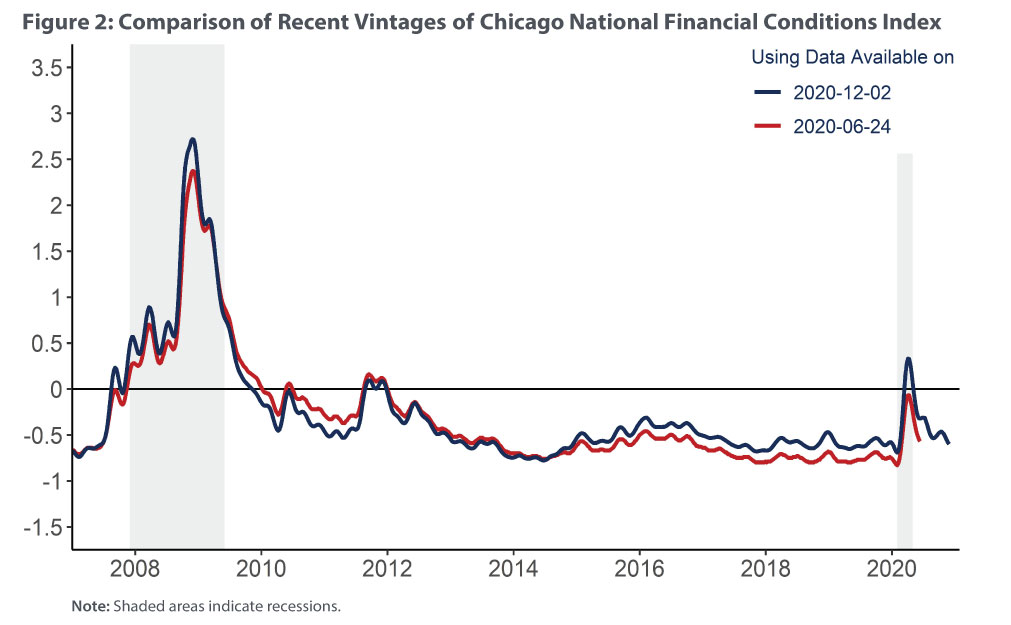
This pattern can be seen in historical values of the index as well. At its peak, the 2008 financial crisis was almost half a standard deviation tighter when comparing the December recalculation to its June counterpart.3 Index recalculations can be tricky, but they are necessary because the underlying statistical or structural models must be reestimated to include valuable information contained in the latest data. These indexes still can be extremely informative, but researchers should try to view longer histories of model-driven indexes to understand how the current level relates to historic levels.
The period over which baseline conditions are calculated also varies by index, and this choice affects index users' ability to compare results across indexes. The base period for the Chicago NFCI, from which the index average and standard deviation are obtained, includes the whole sample (1973 to present), a period that features several episodes of financial stress, including the 1973 recession, the 1987 stock market crash and the 2008 financial crisis. In contrast, the BUSFCI uses a base period of January 1994 to July 2008, a period notably calmer than that of the NFCI. As a result, baseline financial conditions for the NFCI are tighter than baseline conditions for the BUSFCI. Likewise, a value of one in the NFCI is very different (tighter) than a value of negative one in the BUSFCI. The average conditions for the GSFCI are set to the conditions on Oct. 20, 2003, and the average conditions for the STLFSI are calculated from 1993 to present. Again, these differences in base periods clearly influence the interpretation of these indexes. Given these differences, a reliable way to compare the information provided by two FCIs is to compare the direction and magnitude of movements across time.
Other High-Frequency Indexes
Gauging financial conditions is very important to the Federal Reserve, but the Fed also values high-frequency data describing real (nonfinancial) economic conditions and levels of economic uncertainty. To meet these demands, the New York Fed recently developed the Weekly Economic Index, which seeks to track real economic conditions through the use of 10 economic indicators covering consumer behavior, the labor market and production. Other high-frequency indexes include Bloom's Uncertainty Index, the Aruoba-Diebold-Scotti Business Conditions Index and the CBOE Volatility Index (VIX). These indexes seek to gauge economic conditions using different compositions of variables than FCIs. Bloom's Uncertainty Index and the VIX specifically seek to quantify the level of uncertainty present in various parts of the economy.4
These and other indexes are useful real-time indicators of economic conditions that can help assess the likely state and evolution of the aggregate economy in ways FCIs cannot. While both FCIs and aggregate economic indexes provide perspectives on the economy at any given time, comparisons across indexes or across time should be made with care. In particular, differences in construction method, variable choice and baseline period can drive some of the patterns.
Matthew Murphy is a research associate in the Research Department at the Federal Reserve Bank of Richmond. He thanks Richmond Fed colleagues Huberto M. Ennis, Thomas A. Lubik, Karl Rhodes and Alexander L. Wolman for contributing editorial advice and economic insight to this brief.
1
Increased demand for higher-frequency data has motivated the development of various high-frequency data dashboards; examples include the Richmond Fed’s Pandemic Pulse and the Opportunity Insights Economic Tracker.
2
This brief discusses four FCIs commonly used by market participants and researchers. They are valuable examples, but there are several other FCIs with similar interpretations and related caveats. Examples include the Federal Reserve Bank of Kansas City's monthly Financial Stress Index, the Office of Financial Research's daily Financial Stress Index and the International Monetary Fund's monthly Financial Conditions Index.
3
The size of recent index revisions did not go unnoticed by those at the Chicago Fed. See Scott A. Brave, Ross Cole and Michael Fogarty, "What Can Revisions to the NFCI Tell Us about Stock Market Volatility?" Federal Reserve Bank of Chicago blog post, May 4, 2020.
4
See Sylvain Leduc and Zheng Liu, "The Uncertainty Channel of the Coronavirus," Federal Reserve Bank of San Francisco Economic Letter, March 30, 2020.
This article may be photocopied or reprinted in its entirety. Please credit the author, source, and the Federal Reserve Bank of Richmond and include the italicized statement below.
Views expressed in this article are those of the author and not necessarily those of the Federal Reserve Bank of Richmond or the Federal Reserve System.
Subscribe to Economic Brief
Receive a notification when Economic Brief is posted online.
Contact Us