Home Health Care and Aging in Place
Economic Brief
January 2026, No. 26-02
Key Takeaways
- Over time, older households have become more likely to age in place and more likely to receive long-term care at home.
- One possible reason these trends might be related is that increased access to home health care has facilitated aging in place. Factors making home health care more accessible include an increased proportion of married seniors — which provides more opportunities for informal spousal caregiving — and increased public funding for formal home health care through Medicare and Medicaid.
- An alternative hypothesis is that other forces have encouraged aging in place, which has in turn increased the demand for home health care. Potential factors include high home price growth and aging alongside one's neighbors.
The continued aging of the U.S. population has coincided with numerous technological and institutional developments. This raises the possibility that, as retirement becomes more prevalent, the very nature of retirement will change as well. One such change may already be showing up in housing markets. As we've previously documented, older households are increasingly likely to age in place.1 Here, we examine how this trend relates to another: the shift from nursing home care to home health care (HHC).
We consider two hypotheses for why aging in place and HHC move together. The first is that greater access to in-home care reduces the need for institutional care, making it easier for seniors to remain at home. Factors that increase the availability of in-home care include an increase in the number of older individuals who remain married — and thus potentially able to care for their spouses — and increased reimbursement by Medicare and Medicaid.
The second hypothesis is that a stronger preference for aging in place has raised the demand for in-home care and greater public funding to support it. Housing markets may play a role: High returns on owner-occupied housing make aging in place more attractive, especially when downsizing involves taking out a new mortgage at higher rates.2 Another factor is neighborhood aging. Seniors may be more willing to stay put if their neighbors are also long-term residents and their communities offer amenities and services aimed at older households.
Trends in Senior Housing
Figures 1 and 2 — taken from the decennial U.S. Census3 and the American Community Survey — show housing trends for those aged 65-79 and aged 80 and older. Figure 1 shows the fraction of older households who own single-family houses, broken down by age group and marital status. In every category, single-family house ownership rates have increased since 1980: by 11 percentage points among those aged 65-79 and by 16pp among those 80 and older.
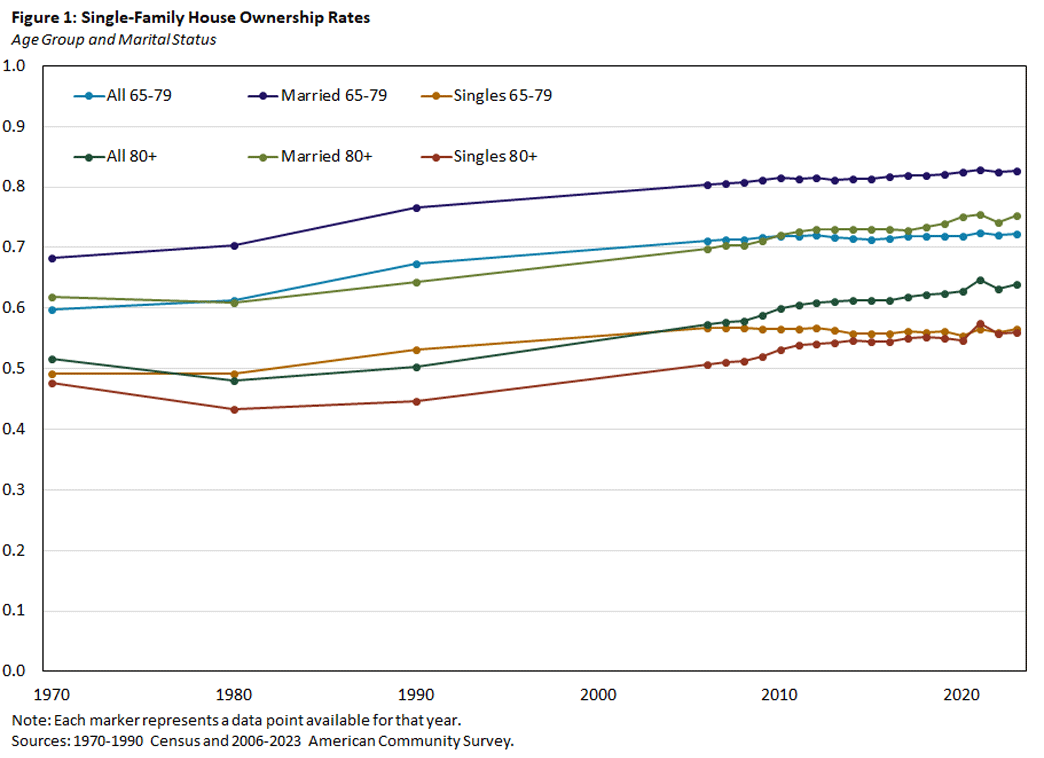
Figure 2 shows the fraction of older households with at least two spare bedrooms. Since 1970, this fraction has risen by 16pp, with similar increases for both age groups. Seniors may end up in a house with spare bedrooms in many ways, but perhaps the simplest explanation is that more are choosing to remain in their home rather than downsizing.4
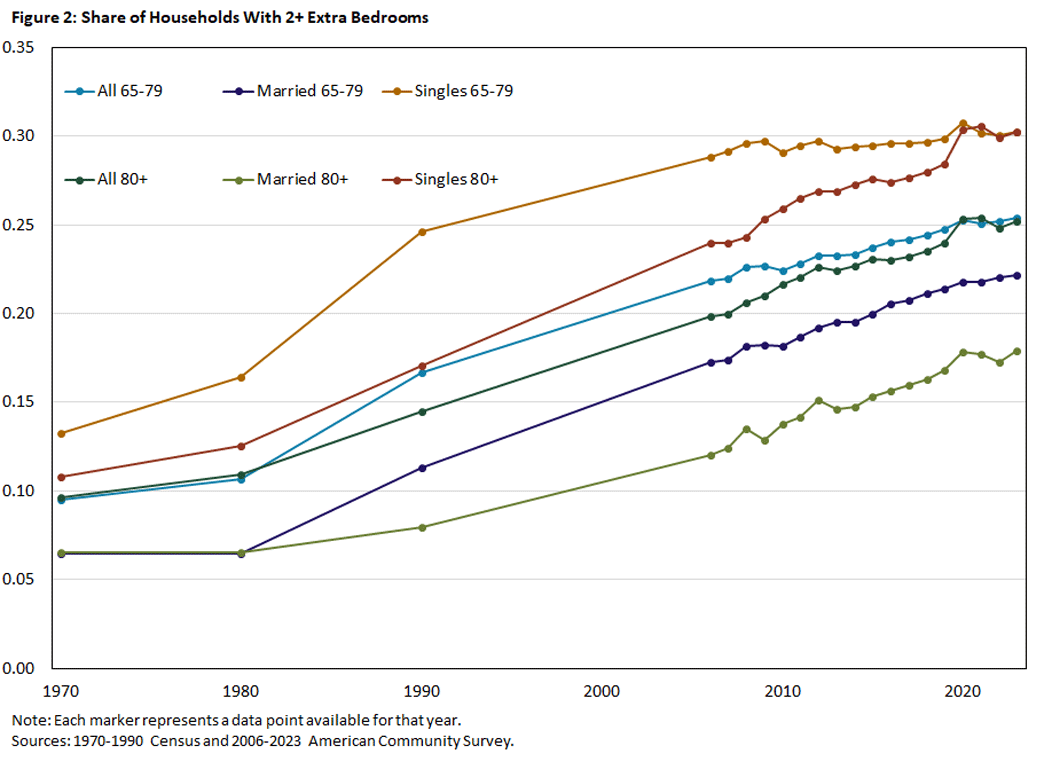
Taken together, Figures 1 and 2 indicate that older households are increasingly likely to age in place.
Trends in Long-Term Care
In our earlier article, we documented that the fraction of households aged 65 and older residing in institutional settings or group quarters fell from 5.5 percent in 1970 to 3 percent in 2020.5 This decline may reflect better health among seniors rather than a shift to HHC. However, we show that, conditional on health, HHC use has been increasing relative to nursing home care.
For assessing long-term care needs, the most informative measure of health is the ability to perform activities of daily living (ADLs), which are tasks essential to independent living. To measure this, we turn to the Health and Retirement Study (HRS), a panel survey of older individuals that records (among many other variables) whether respondents report difficulty performing one or more ADLs. We will often refer to these difficulties as functional limitations.
Table 1 reports results from a set of linear probability regressions predicting whether an individual resides in a nursing home. All regressions include a full set of age dummies. In all specifications, the likelihood of nursing home residence declines with each successive birth year, indicating that older adults have become less likely to live in nursing homes over time, all else equal. The decrease ranges from 0.05pp to 0.10pp per year.
Comparing the first and second regressions shows that individuals with more ADL difficulties are much more likely to reside in a nursing home. Nearly 40 percent of individuals with four or five limitations are in nursing homes. Comparing the R2 statistics for the two regressions shows that health, as measured by ADL limitations, has far more predictive power than age or birth year.
| (1) | (2) | (3) | (4) | |
|---|---|---|---|---|
| NH | NH | NH | NH | |
| Year of Birth | -0.0010*** | -0.0007*** | -0.0006*** | -0.0005*** |
| (0.0002) | (0.0002) | (0.0002) | (0.0002) | |
| 1 ADL Difficulty | 0.0531*** | 0.0527*** | 0.0472*** | |
| (0.0059) | (0.0059) | (0.0056) | ||
| 2-3 ADL Difficulties | 0.1555*** | 0.1542*** | 0.1454*** | |
| (0.0107) | (0.0106) | (0.0101) | ||
| 4-5 ADL Difficulties | 0.3854*** | 0.3836*** | 0.3723*** | |
| (0.0124) | (0.0124) | (0.0121) | ||
| Married | -0.0180*** | -0.0082*** | ||
| (0.0023) | (0.0017) | |||
| Female | -0.0005 | -0.0006 | ||
| (0.0021) | (0.0021) | |||
| Homeowner | -0.0405*** | |||
| (0.0041) | ||||
| R2 | 0.0350 | 0.2278 | 0.2301 | 0.2383 |
| Observations | 61,609 | 61,609 | 61,609 | 61,609 |
| Notes: The sample consists of individuals aged 70 and older. Regressions include a full set of age dummies. Robust standard errors are clustered by birth year. *** indicates statistical significance at the 1 percent level. Source: 2006-20 Health and Retirement Study. |
||||
Table 1 also shows that being married reduces the likelihood of living in a nursing home, as does being a homeowner. The homeowner effect is partly mechanical since individuals sometimes sell their homes to pay for nursing home care.
Table 2 presents the results for a parallel set of regressions that predict the odds of receiving formal HHC. The likelihood of receiving HHC has increased over time. As with nursing home care, individuals with ADL difficulties are more likely to receive HHC. The effects for those with one or with two to three ADL difficulties are in fact larger than those for nursing home care and somewhat smaller for those with four to five difficulties. This suggests that HHC is most practical for individuals with low to moderate difficulty in living independently.6 Nonetheless, a significant number of individuals with four to five limitations receive HHC.
| (1) | (2) | (3) | (4) | |
|---|---|---|---|---|
| HHC | HHC | HHC | HHC | |
| Year of Birth | 0.0002 | 0.0006** | 0.0007*** | 0.0008*** |
| (0.0003) | (0.0003) | (0.0003) | (0.0003) | |
| 1 ADL Difficulty | 0.2084*** | 0.2077*** | 0.2050*** | |
| (0.0099) | (0.0099) | (0.0098) | ||
| 2-3 ADL Difficulties | 0.3181*** | 0.3160*** | 0.3116*** | |
| (0.0133) | (0.0133) | (0.0134) | ||
| 4-5 ADL Difficulties | 0.3156*** | 0.3130*** | 0.3074*** | |
| (0.0134) | (0.0133) | (0.0132) | ||
| Married | -0.0316*** | -0.0268*** | ||
| (0.0041) | (0.0040) | |||
| Female | -0.0041 | -0.0042 | ||
| (0.0045) | (0.0045) | |||
| Homeowner | -0.0200*** | |||
| (0.0054) | ||||
| R2 | 0.0275 | 0.0987 | 0.1005 | 0.1010 |
| Observations | 61,609 | 61,609 | 61,609 | 61,609 |
| Notes: The sample consists of individuals aged 70 and older. Regressions include a full set of age dummies. Robust standard errors are clustered by birth year. ** and *** indicate statistical significance at the 5 percent and 1 percent levels, respectively. Source: 2006-20 Health and Retirement Study. |
||||
Married individuals are less likely to receive formal HHC, largely because they substitute informal spousal care for paid services. A 2019 paper, also using HRS data, shows that married individuals with functional limitations are far more likely to receive informal care than their unmarried counterparts.7 Homeowners are also less likely to receive formal HHC, a result that may reflect omitted factors such as access to informal care or additional health conditions not captured by functional limitations.
Narratives
The preceding results show that, as older households have become more likely to age in place, they have also become more likely to receive long-term care at home. How do the two trends relate?
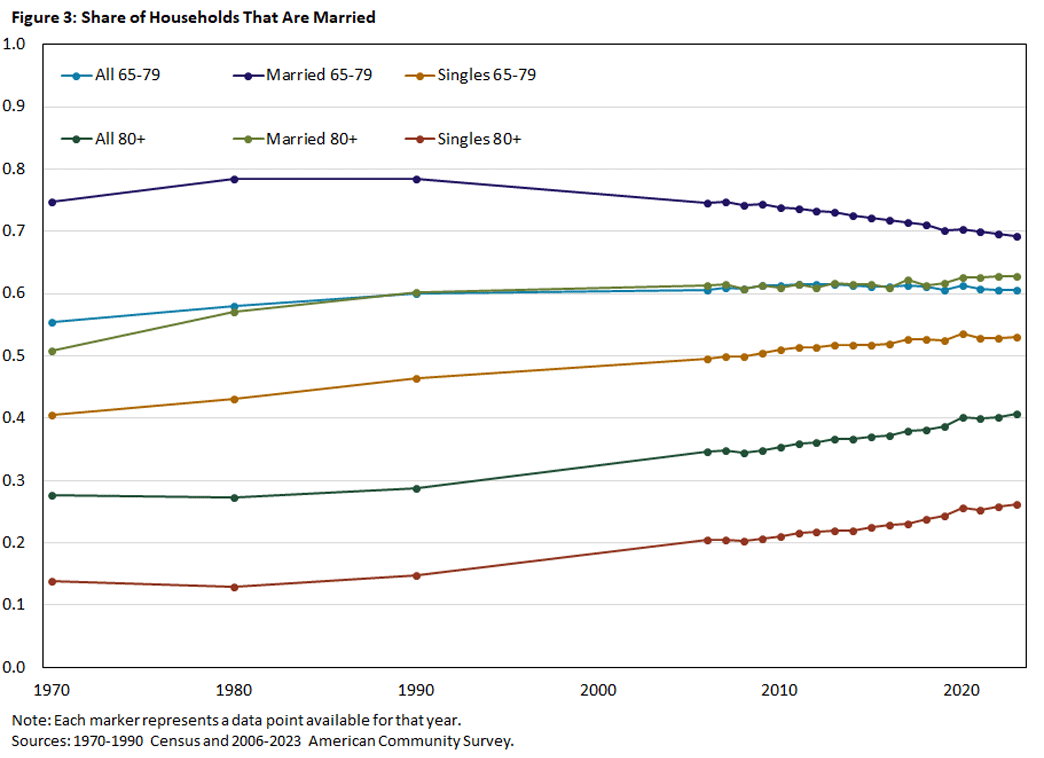
One potential reason that aging in place and HHC move together is that greater access to HHC makes aging in place more desirable. At least two trends have been encouraging HHC use. The first is an increase in the number of households who are married. Figure 3 shows that, between 1970 and 2023, the fraction of older households who are married rose by 5pp among those 65-79 and around 13pp among those 80 and older. When one spouse acquires functional limitations, the other often becomes the primary caregiver. A 2023 paper also found that surviving spouses who had been caregivers were more likely to sell their homes after their partner's death, suggesting that many couples remain at home specifically to facilitate informal care.8
A second factor making HHC more attractive has been greater financial support from Medicare and Medicaid. While public interest in HHC has grown for many reasons,9 one of the most important was the 1999 Olmstead decision, where the U.S. Supreme Court ruled that the Americans with Disabilities Act imposed an "integration mandate." This principle held that individuals with disabilities should reside in their local communities rather than in institutions whenever feasible and in accordance with their wishes. Following the decision, Medicaid expanded support for HHC.10
Using the National Health Expenditure Accounts, Figure 4 shows that the fraction of HHC expenditures reimbursed through the Centers for Medicare and Medicaid Services (CMS) programs rose by 38pp between 1967 and 2023, with more than half of the increase occurring after 2000 and most of it implemented through Medicaid.11
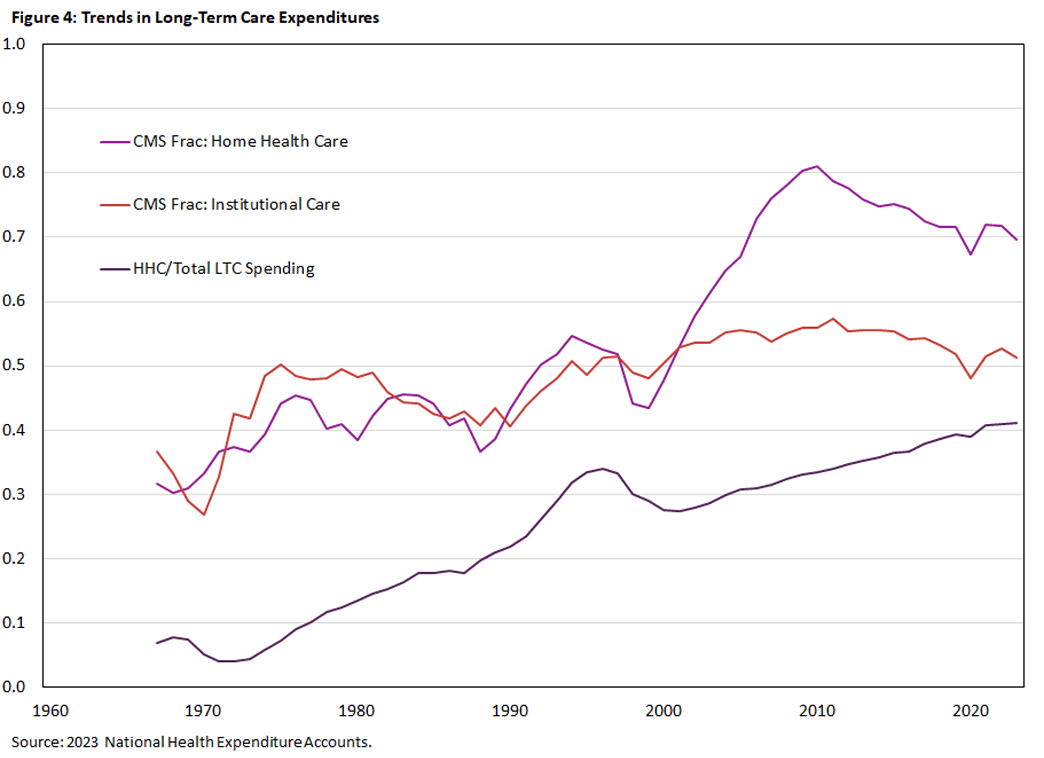
Over the same period, CMS support for institutional care rose by 15pp, with nearly all of the increase occurring before 1975. The HHC share of total long-term care expenditures, however, has increased at a constant rate since 1970. This suggests that other factors are involved. It may also indicate that the effects of the integration mandate took time to land, as housing decisions are slow to adjust and often irreversible.
An alternative explanation is that nonhealth factors have made individuals more willing to age in place, with HHC use increasing in response. One such factor may be the ongoing increase in house prices. Between 2000 and 2024, the average real rate of capital gains on housing was 1.9 percent per year, more than double the 0.8 percent annual rate from 1975 to 2000.12 Many local housing markets saw even larger gains.
Another potential factor is neighborhood aging. As the share of retired households in a neighborhood grows, each older household may be more inclined to stay put — both because they value familiar neighbors and because businesses, governments and other local institutions increasingly cater to seniors. Examples include the public services provided to naturally occurring retirement communities and the self-funded assistance available in communities that adopt the village model.13
Discussion
Aging in place and HHC can reinforce one another. Developments that make aging in place more desirable increase the demand for HHC, often bringing with it greater public support and new ways of delivering care. At the same time, increased access to HHC — whether formal or informal — makes it easier for households to age in place. As more neighbors choose to stay put, they can generate externalities that make aging in place even more desirable. In ongoing work, we are seeking to disentangle these interactions through detailed statistical analysis and economic modeling.
John Bailey Jones is a vice president and economist in the Research Department of the Federal Reserve Bank of Richmond, Yue Li is an associate professor of economics at the University at Albany, State University of New York, and Urvi Neelakantan is a senior policy economist in the Research Department of the Federal Reserve Bank of Richmond. The authors thank, without implicating, Jane Ginsburg and Sim Goldman for helpful conversations. Any remaining mistakes are those of the authors.
1
See our 2024 article "The Living Arrangements of Older Households."
2
In Table 1 of the 2023 paper "The House – Is it an Asset or a Liability?," Leora Friedberg, Wei Sun and Anthony Webb report that, among recent cohorts, half of homeowners ages 64-66 had outstanding mortgages.
3
For the figures, we dropped data from the 2000 Census because the MARST variable appears to overstate the incidence of marriage among persons living in group quarters. In the 2000 5 percent sample, 20 percent of group quarters residents aged 18 and under are coded as married. In other census years, the fraction is less than 1 percent.
4
Figure 4 of "The Living Arrangements of Older Households" shows that older households have become increasingly unlikely to move.
5
See Figure 3 of "The Living Arrangements of Older Households."
6
Since HHC is billed by the hour, individuals needing less care pay less. To get a sense of scale, according to the 2024 Genworth Cost of Care Survey, the median cost of a home health aide is $34/hour, of living in an assisted living community is $70,800/year and of a private nursing-home room is $127,750. Suppose that the room and board provided in institutional settings is worth $30,000 per year. The median annual cost of living in an assisted living community ($70,800-$30,000) is thus equivalent to purchasing 23 hours of HHC per week, and the cost of a private nursing-home room is equivalent to purchasing 55 hours per week.
7
See the 2019 paper "Long‐Term Care Across Europe and the United States: The Role of Informal and Formal Care" by Daniel Barczyk and Mathias Kredler.
8
See the 2023 paper "Marital Transitions, Housing, and Long-Term Care in Old Age" by Minsu Chang and Ami Ko.
9
See the 1993 paper "An Historical Perspective on Home Care Policy" by A.E. Benjamin.
10
See the 2014 issue brief "Olmstead's Role in Community Integration for People with Disabilities Under Medicaid: 15 Years After the Supreme Court's Olmstead Decision" by MaryBeth Musumeci and Henry Claypool.
11
These data report expenditures for all ages.
12
Real rates of return calculated using the U.S. Federal Housing Finance Agency, All-Transactions House Price Index and the Consumer Price Index.
13
See the 2021 review article "Promising Aging in Community Models in the U.S.: Village, Naturally Occurring Retirement Community (NORC), Cohousing, and University-Based Retirement Community (UBRC)" by Su‑I Hou and Xian Cao.
To cite this Economic Brief, please use the following format: Jones, John Bailey; Li, Yue; and Neelakantan, Urvi. (January 2026) "Home Health Care and Aging in Place." Federal Reserve Bank of Richmond Economic Brief, No. 26-02.
This article may be photocopied or reprinted in its entirety. Please credit the authors, source, and the Federal Reserve Bank of Richmond and include the italicized statement below.
Views expressed in this article are those of the authors and not necessarily those of the Federal Reserve Bank of Richmond or the Federal Reserve System.
Subscribe to Economic Brief
Receive a notification when Economic Brief is posted online.
Contact Us