Finding a Job: Higher-Skilled and Lower-Skilled Workers in Demand
Regional Matters
May 9, 2016

Economists have noted that as technology has become more widely diffused through the economy, the nature of work has changed and businesses seek workers with different skill sets than in the past. Technology has created new jobs while making others obsolete or less abundant. In particular, economists have found that employment growth has been stronger for higher-skilled jobs and for lower-skilled jobs while there has been less demand for middle-skilled jobs. Looking at occupation data from the Bureau of Labor Statistics (BLS), it appears that this trend has been at work in recent years in the Fifth District as higher-skilled and lower-skilled occupations have experienced greater employment growth than middle-skilled occupations.
The BLS publishes information on the number of people employed and the distribution of wages for 22 major occupation groups and over 800 detailed occupations. The occupation data is not normally used as a source for evaluating the labor market over the business cycle due to the nature of the survey. The Occupational Employment Survey (OES) is reported annually, but the data is collected from establishments in six semiannual panels for three consecutive years. Every six months a new panel is added and the oldest is dropped. In addition, there have been numerous classification and methodological changes to the survey over time. As a consequence, the BLS cautions that it is difficult to use OES data for comparisons across short time periods. However, a careful use of the data to examine two periods far enough apart after the survey was changed should allow for a comparison — with the important caveat that the BLS did not create this survey with the intention of the data being used for time series analysis.
Table 1 lists the 10 largest major occupations in the Fifth District, including the share of total occupations for each jurisdiction and the median annual salary. There are a couple of aspects of the occupation profile for the Fifth District worth noting. The five largest occupations within the Fifth District are: office and administrative support (15.1 percent of all occupations), sales (10.3 percent), food preparation and serving (9.0 percent), transportation and material moving (6.3 percent), and education, training and library (6.3 percent). This is very similar to the top five occupations for the entire United States, with the exception that education is sixth and production occupations is fifth.
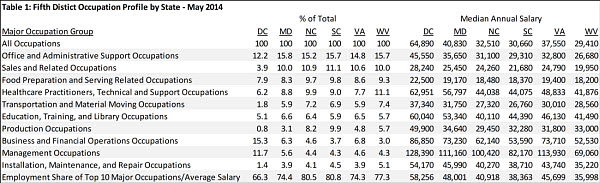
Of the top 10 major occupations, half of them (which represent slightly less than 50 percent of all employment) have a median annual salary below the median annual salary for all occupations. The other five occupations, which have a higher median annual salary, account for almost 30 percent of all employment. Of course, the difference in these salaries reflects the education level and experience required for these occupations. For example, most of the detailed occupations within the highest-paying occupation group (management) require a bachelor's degree or higher with five years or more of experience. In contrast, production occupations require moderate- to long-term training instead of a postsecondary or college degree.
It is also worth noting that there is significant wage variation within these major occupation groups. For example, the median annual salary in Maryland for the office and administrative support occupation category is $35,650, but the annual salary at the 10th and 90th percentile is $19,550 and $59,610, respectively. For the sales and related occupations category, the annual salary at the 10th and 90th percentile is $16,730 and $73,760, respectively. Some occupations within a major occupation group will have a higher (or lower) education level and perhaps additional skills requirements and as a consequence will command a higher (or lower) salary.
So how have occupations changed since the end of the Great Recession in terms of employment and wages? Table 2 lists the change in Fifth District employment and median annual salary from 2010 to 2014 for the 22 major occupation categories. The table is ranked by 2010 median annual salary, and the box includes the major occupation categories that were within 15 percent of the median annual salary for all occupations in 2010 — which represents one-third of all occupations. The categories above the box had median annual salaries at least 15 percent greater than the 2010 median annual salary (and represented 32 percent of all occupations), and those categories below had salaries at least 15 percent lower (and represented 34 percent).
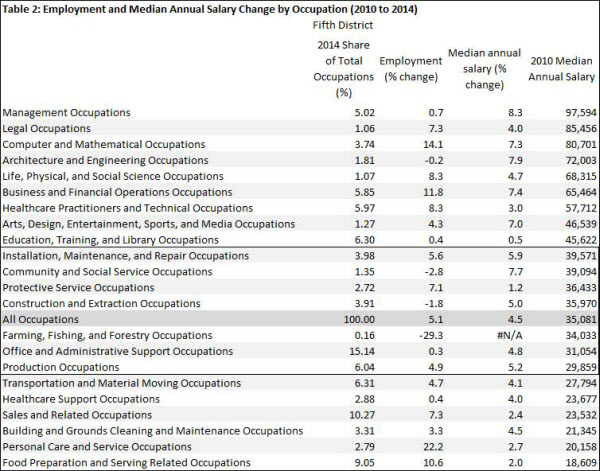
Overall, total employment grew by 5.1 percent from 2010 to 2014, according to the OES data, while wage growth was very weak — just 4.5 percent over the four-year period. When taking inflation into account, real median annual salary growth was negative since inflation was 7.3 percent from 2010 to 2014, according to the personal consumption price index. Wages grew faster for higher-salary occupations than for middle-salary or lower-salary occupations. The average increase for higher-salary occupations was 5.6 percent across occupations versus 4.9 percent and 3.3 percent for middle- and lower-salary occupations, respectively.
Higher-salary and lower-salary occupations grew at faster rates than middle-salary occupations. There was a 5.9 percent increase in employment for the 10 major occupation groups with the highest 2010 median annual salaries while employment rose by 7.7 percent for the six major occupation categories that had the lowest median annual salaries. For the six major occupation categories that had salaries close to the median annual salary in 2010, employment rose by just 1.7 percent.
Although these major occupation categories are ranked by median salary, they also reflect education and skill level. Of the 10 major categories in the higher-salary group, all but a few require at least a college degree and on-the-job training. In contrast, the six lower-salary occupations typically do not require a college degree but instead are occupations that require some on-the-job training. A good number of the middle group contain occupations that require some education (community and social service, some office occupations) or specific skills learned in moderate-term to long-term training (installation, maintenance, repair, construction, production).
The results in Table 2 are broadly consistent with work that looks at occupation trends in prior periods. In his paper, "U.S. Labor Market Challenges over the Longer Term," David Autor looks at the change in occupation growth from 1979 to 2009 for 10 major occupations. He finds that for the highly educated and highly paid occupations (managerial, professional, and technical) employment growth was robust over the past three decades while growth for service occupations, which disproportionately do not have postsecondary degrees and earn low wages (protective services, food and cleaning services, personal care), was also rapid. Autor finds that middle-educated and middle-paid occupations (office workers, production, craft and repair, and operators, fabricators and laborers) grew at slower pace and that the pace declined over time.
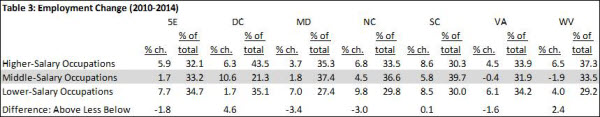
These trends are evident at the state level as well. Table 3 depicts the percent change in employment for middle-salary, higher-salary, and lower-salary occupations for each Fifth District jurisdiction. For each jurisdiction, major occupations were ranked by 2010 median salary and the occupations within roughly 15 percent of the median annual salary were grouped as "middle-salary" while all other occupations above or below were categorized as "higher-salary" or "lower-salary" and the change in employment was calculated for each group. With the exception of the District of Columbia, the middle-salary occupation group grew slower than higher- and lower-salary occupations. In three of the Fifth District jurisdictions, lower-salary occupations grew faster than higher-salary occupations (Maryland, North Carolina, and Virginia), in two jurisdictions, higher-salary occupations grew faster (District of Columbia and West Virginia), and in one case the growth rates were virtually the same (South Carolina).
This report contains excerpts from a recent Econ Focus article, and therefore uses OES data from 2014, which was the latest available at the time that article was written. The BLS recently released 2015 data.
Have a question or comment about this article? We'd love to hear from you!
Views expressed are those of the authors and do not necessarily reflect those of the Federal Reserve Bank of Richmond or the Federal Reserve System.
Contact Us