Skip to Main Content

Post-Recession Labor Market Trends in the Fifth District

Econ Focus
Third Quarter 2015
District Digest

Dislocations in the labor market during the Great Recession were severe and the recovery was slow. It took slightly more than four years for the numĀ­ber of jobs to return to pre-recession levels in the Fifth District, and the unemployment rate remained higher more than six years after the recession ended. The effect varied across regions and industry sectors, however. The least-affected industry sectors enjoyed rapid turnarounds once the recession ended; for example, the education and health sector never experienced job loss and has grown at a healthy pace since the end of the recession. In contrast, other sectors, those most heavily hit by the recession, experienced very shallow recoveries with slow job growth and have yet to fully recover jobs lost during the recession.

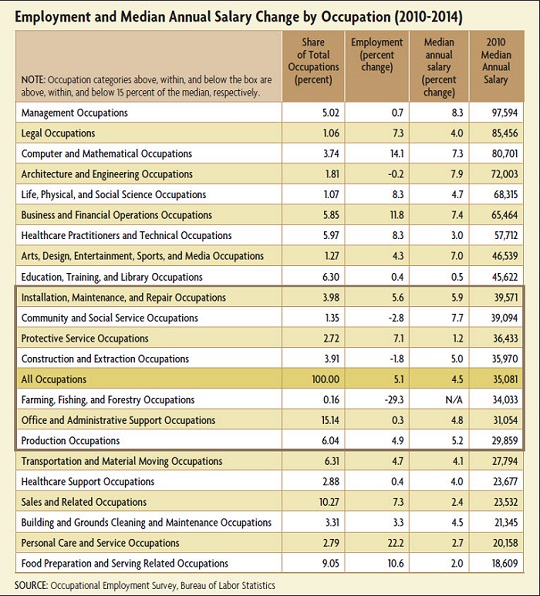
Underlying these trends are changes in the skill sets and experience sought by firms. Economists have noted that as technology has become more widely diffused through the economy, businesses have been seeking workers with different skill sets than in the past. Technology has created new jobs while making others obsolete or less abundant. In particular, economists have found that employment growth has been stronger for higher-skilled jobs and for lower-skilled jobs while there has been less demand for middle-skilled jobs. Looking at occupation data from the Bureau of Labor Statistics (BLS), it appears that this trend has been at work in recent years in the Fifth District as higher-skilled and lower-skilled occupations have experienced greater employment growth than middle-skilled occupations.

Industry Sector Trends

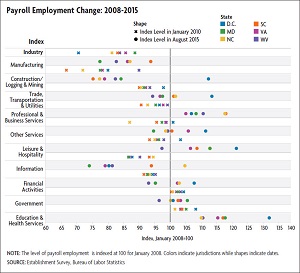
The Great Recession had varying effects on different sectors of the Fifth District economy. The two sectors most negatively impacted during the downturn were the construction and manufacturing sectors. The collapse of the housing market resulted in a sharp decrease in employment in the construction sector as well as a number of other sectors that feed into the housing sector: retail and wholesale trade, transportation, finance, and manufacturing. The manufacturing sector was heavily affected by the broad decline in domestic and foreign demand for U.S.-produced goods, both consumer and industrial. The total declines in Fifth District employment in construction and manufacturing were 24 percent and 16 percent, respectively, from January 2008 to January 2010, far greater than the 5.6 percent decline in employment across all sectors. (Although the recession technically began in December 2007 and ended in June 2009, this article uses January 2008 and January 2010 to allow for full-year comparisons and minimize seasonality issues.)

Notably, not only were these two sectors most greatly affected by the recession, they were the slowest to recover (excluding the information sector, mainly print and telecommunications, where the continued decline in employment represents a secular decline due to structural changes rather than cyclical factors). From January 2010 to August 2015, employment growth in the housing and manufacturing sectors increased 5.5 percent and 4.3 percent, respectively, well below the Fifth District industry average of 8.1 percent.

While job loss in the manufacturing and construction sectors was severe across the Fifth District during the recession, there was considerable variation among states. But in the Fifth District states with the largest manufacturing sectors, Virginia, North Carolina, South Carolina, and West Virginia, the losses were fairly comparable — between 14 percent and 19 percent. Job growth since January 2010 has varied, as well. There has been little increase in jobs in Virginia and West Virginia, despite strong production in auto manufacturing and chemical manufacturing in West Virginia. In contrast, the auto and aerospace sectors have driven growth in the manufacturing sector in North Carolina and South Carolina in recent years. Manufacturing employment in both states has improved considerably — up 7 percent and 13 percent, respectively, but still remains well below pre-recession levels.

The decline in the construction sector during the recession varied across jurisdictions. South Carolina experienced the largest decline, followed by North Carolina — 33 percent and 27 percent, respectively. Interestingly, the metro areas of the Fifth District that were most caught up in the housing boom and subsequent collapse were in the northern part of the district, Washington, D.C., and Baltimore. Yet the decline in construction employment in Maryland and the District of Columbia was not as severe as in the Carolinas.

In any event, the recovery in construction employment has been lackluster. With the exception of West Virginia, there have been increases in construction jobs, but the level of employment in August 2015 was well below pre-recession levels. The recovery in the single-family housing market has been very moderate; while construction of multi-family housing units has been strong, particularly in the Washington, D.C., region, it has not been enough to offset the softness in the single-family market.

Where there have been significant gains in employment in recent years has been in services. The professional and business services sector, the leisure and hospitality sector, and the education and health sector have each seen significant growth since 2010 with increases of 16 percent, 15 percent, and 11 percent, respectively. Notably, these sectors all experienced more moderate employment declines (or no decline at all in the case of education and health) relative to other sectors during the downturn. Professional and business services and leisure and hospitality declined 4.8 percent and 4.3 percent, respectively, while employment in education and health grew by 3.6 percent from January 2008 to January 2010. The employment increases in the professional and business services and leisure and hospital sectors have been widespread across jurisdictions, with the exception of leisure and hospitality in West Virginia, where there has been little to no net growth since January 2010.

Different factors influenced the goods-producing and service-providing sectors across Fifth District jurisdictions. As mentioned earlier, the growth of the auto and aerospace sectors in the southern part of the district resulted in employment gains and additional investment in those sectors, as did ancillary sectors that served as suppliers and distributors. The shale gas boom affected the demand for manufactured goods, construction, and the provision of services in West Virginia. Federal spending cuts heavily impacted service-providing sectors in the northern jurisdictions. 

Occupation Trends

The chart illustrates the employment losses during the downturn and employment gains since by industry for each of the six jurisdictions in the Fifth District. The level of payroll employment is indexed at 100 for January 2008, when payroll employment peaked in the United States; the level of employment in January 2010, the trough in employment, is shown with an "x" and the August 2015 level with a circle. Thus, if an industry lost jobs during the recession, there would be an x at a level below 100 for January 2010. Employment growth during the recovery is indicated by a circle at an index level to the right of the corresponding "x." Circles at index levels greater than 100 indicate that the state's industry sector more than fully recovered the jobs lost during the recession; for example, an index value of 103 in August 2015 would indicate that employment was 3 percent higher than at the beginning of the recession (January 2008).

What is also notable is that industries that employ more higher-skilled workers (professional and business services, education and health sector) and those that employ more lower-skilled workers (leisure and hospitality) saw the largest increases over the past five years. At the same time, the industries with more middle-skilled workers (production and trades) experienced the weakest recoveries. These observations are just suggestive, however. It would also be useful to look at the changes in occupations during the recovery to get a better sense of whether higher-skilled and lower-skilled workers fared better during the recovery than middle-skilled workers.

The BLS publishes detailed labor market data by occupation. There are 22 major occupation groups and over 800 detailed occupations for which the bureau publishes data on the number of people employed as well as the distribution of wages. The occupation data is not normally used as a source for evaluating the labor market over the business cycle, however, due to the nature of the survey. The Occupational Employment Statistics survey (OES) is reported annually, but the data is collected from establishments in six semiannual panels for three consecutive years. Every six months, a new panel is added and the oldest is dropped. In addition, there have been numerous classification and methodological changes to the survey. As a consequence, the BLS cautions that it is difficult to use OES data for comparisons across short time periods. Still, a careful use of the data to examine two periods far enough apart and after the changes made to the survey should allow for a comparison — with the important caveat that the BLS did not create this survey with the intention of the data being used for time series analysis.

The table below lists the largest 10 major occupation groups in the Fifth District, including each group's share of total occupations for each jurisdiction and median annual salary. The five largest occupation groups within the Fifth District are office and administrative support (15.1 percent of all occupations), sales (10.3 percent), food preparation and serving (9.0 percent), transportation and material moving (6.3 percent), and education, training, and library (6.3 percent); this is very similar to the top five occupation groups for the entire United States.

The differences in salaries among occupations typically reflect the education level and experience required. For the highest-paying occupation group, management, the majority of the detailed occupations require a bachelor's degree or higher with five years or more of experience. In contrast, production occupations require moderate- to long-term training instead of a postsecondary or college degree.

Within the major occupation groups, there is significant variation. For example, the median annual salary in Maryland for the office and administrative support occupation category is $35,650, but the annual salary at the 10th and 90th percentile is $19,550 and $59,610, respectively; for the sales and related occupations category, the annual salary at the 10th and 90th percentile is $16,730 and $73,760, respectively. So it is important to note that the median salary for the major occupation categories incorporate the median education and skills level across all detailed occupations and that some occupations within a major occupation group will have higher (or lower) education level and perhaps additional skills requirements. As a consequence, they will command a higher (or lower) salary.

So how have occupations changed since the end of the Great Recession in terms of employment and wages? The table below lists the changes in Fifth District employment and median annual salary from 2010 to 2014 for the 22 major occupation categories; the categories are ranked by 2010 median annual salary. The categories above the box had median annual salaries at least 15 percent greater than the 2010 median annual salary; the categories within the box were within 15 percent of the median; and the categories below had salaries at least 15 percent lower. Each of these three major divisions of the categories represents roughly one-third of all occupations. 

Overall, total employment grew by 5.1 percent from 2010 to 2014 according to the OES data, while wage growth was very weak — just 4.5 percent in total over the four-year period. When taking inflation into account, real median annual salaries were negative as inflation grew by 7.3 percent from 2010 to 2014, based on the personal consumption price index. Wages grew faster in percentage terms for higher-salary occupations than for middle-salary or lower-salary occupations: The average increase for higher-salary occupations was 5.6 percent across occupations versus 4.9 percent and 3.3 percent for middle- and lower-salary occupations, respectively.

With respect to the structure of demand for workers, the occupational data show much the same pattern as the industry data: Higher-salary and lower-salary occupations grew at faster rates than middle-salary occupations. Of the nine major occupation groups that had higher 2010 median annual salaries, six experienced an increase in employment and three were relatively flat (below a 1 percent change). Across all higher-salary occupations combined, there was a 6.2 percent increase in employment. Of the seven occupations that had salaries close to the median annual salary in 2010, three experienced an increase, three saw a decline, and one was flat. Overall, employment rose by 1.8 percent for this group. Finally, for the six major occupation categories that had lower median annual salaries in 2010, five experienced an increase while one was flat. In the lower-salary occupations combined, employment rose by 7.9 percent.

The differences in median salary generally reflect education and skill requirements. Of the nine major categories in the higher-salary group, all but a few require at least a college degree or a college or higher degree and on-the-job training. Also, arts and design as well as education and training are broad categories that contain a mix of occupations, some of which require college or advanced degrees while others require a degree and specific skills or on-the-job training, and still others require no college degree. In contrast, the six lower-salary occupation categories typically do not require a college degree but instead represent occupations that require some on-the-job training. In the middle group, a good number of the occupations require some education (community and social service, some office occupations) or specific skills learned from medium-term to long-term training (installation, maintenance, repair, construction, production).

These results are broadly consistent with work that looks at national occupation trends in prior periods. In his 2010 paper "U.S. Labor Market Challenges over the Longer Term," David Autor of the Massachusetts Institute of Technology looks at the change in occupation growth from 1979 to 2009 for 10 major occupations. He finds that for the highly educated and highly paid occupations (managerial, professional, and technical), employment growth was robust over the past three decades; growth for service occupations, which disproportionately do not require postsecondary degrees and earn low wages (protective services, food and cleaning services, personal care), was also rapid. In contrast, Autor finds that middle-educated and middle-paid occupations (office workers, production, craft and repair, and operators, fabricators and laborers) grew at slower pace and that the pace declined over time.

These trends are evident within the Fifth District at the state level, as well. With the exception of the District of Columbia, the middle-salary occupation group grew slower than higher- and lower-salary occupations. In three of the Fifth District jurisdictions, lower-salary occupations grew faster than higher-salary occupations (Maryland, North Carolina, and Virginia); two experienced faster growth of higher-salary occupations than lower-salary (District of Columbia and West Virginia); and in one state, the growth rates were the same (South Carolina).

Conclusion

There has been significant improvement in the labor market since the end of the Great Recession. Total payroll employment growth has fully recovered in each jurisdiction in the Fifth District; however, employment levels in some sectors remain below their pre-recession levels. Notably, in most jurisdictions, employment in the sectors hit the hardest remains well below its pre-recession level.

At the same time, employment growth in several service sectors that were least affected by the recession have shown strong growth in recent years. Relatedly, there has been significant growth in higher-salary and higher-skilled occupations and lower-salary and lower-skilled occupations in recent years. Growth in middle-salary and middle-skilled occupations has been more modest, however. This pattern is consistent with studies that have shown a widening gap between higher- and lower-skilled occupations and middle-skilled occupations in the United States and other advanced economies. Lastly, wage growth was very weak from 2010 to 2014. The annual median salary did not keep pace with inflation, although occupations with higher skill levels fared better than those with lower skill levels.

Subscribe to Econ Focus

Receive an email notification when Econ Focus is posted online.

Subscribe to Econ Focus

By submitting this form you agree to the Bank's Terms & Conditions and Privacy Notice.

Phone Icon Contact Us

David A. Price (804) 697-8018