What's Up With Housing?
Regional Matters
January 19, 2018

It has been more than a decade now since the collapse of the housing market. Single-family housing starts in the United States, which are reported by the Census Bureau, peaked in 2005 while, according to the CoreLogic home price index, home prices peaked in 2006. Both subsequently plummeted, with an 80 percent decline in starts and a 35 percent decline in home prices. Since the crash, the housing market has been moving up but at a very gradual and uneven pace.
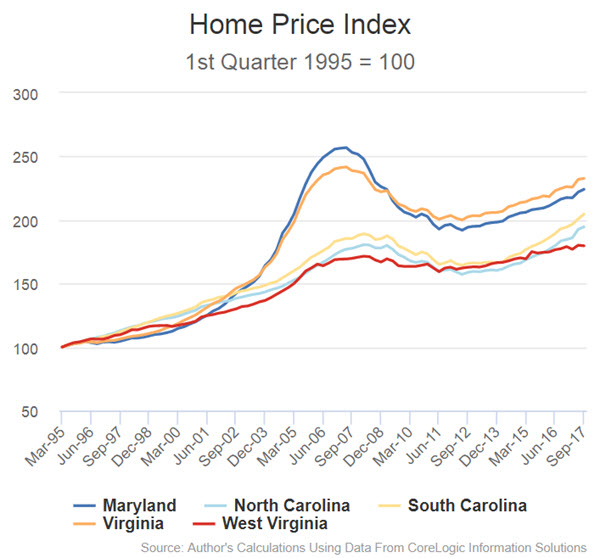
In the Fifth District, housing permits have increased 83 percent and home prices have risen 24 percent from their respective lows in 2011. Of course, this varies considerably across Fifth District jurisdictions, particularly between the northern areas where markets rose to greater heights (and subsequently fell harder) and in the southern areas (in South Carolina in particular) where strong economic growth has resulted in stronger residential markets in recent years (see charts below). Still, it has been the case that the recovery in the single-family housing market has been much more modest than anticipated.
Each month, the National Association of Realtors© (NAR) releases a report detailing the number of existing homes sold. For some time now, the NAR has noted that low inventories have restrained sales, particularly sales for entry-level homes. In September, the chief economist of the association, Lawrence Yun, noted in a report that “What’s ailing the housing market and continues to weigh on overall sales is the inadequate levels of available inventory and the upward pressure it’s putting on prices in several parts of the country.”
Low inventories have also been cited by Federal Reserve Banks as well. In the November 2017 Beige Book, nine of the 12 regional Reserve Banks (including the Richmond Fed) reported low housing inventories with the majority indicating that these low levels negatively impacted sales. With less supply on the market it is not surprising that home prices have been pushed higher. In a December 2017 blog post, the deputy chief economist at CoreLogic, Sam Khater, looked at the relationship between inventories and home prices and found that “the smaller the inventory, the more impact on driving selling prices up. This lack of supply is disproportionally driving up low-end home prices.”
Despite low inventories and rising prices, the increase in homebuilding has been very modest over the past eight years. In fact, the level of U.S. and Fifth District housing starts and permits in 2017 was roughly 85 percent of the average for the 1990s. New home sales are still below the 1990s average, and at 283,000, the inventory of new homes for sale in the United States is on the low side for the range during the 1990s. Why supply has been slow to respond is not an easy question to answer. Homebuilders are apparently positive about the outlook. The National Association of Home Builders/Wells Fargo Housing Market Index—a survey of homebuilders, which gauges builders’ perspective of the single-family housing market—reached its highest level since 1999 in December 2017. So what’s going on?
Surveys and contacts with homebuilders suggest that land availability is an issue. A July 2017 survey by the National Association of Home Builders (NAHB) indicated that 64 percent of builders reported that the overall supply of developed lots in their areas was “low to very low.” Sixty-four percent represented the largest response since the NAHB began asking the question in 1997. According to the association, “the continued low supply of developed lots is a hindrance to the housing recovery.” With “low or very low” developed lots in many parts of the country, it is not surprising that land costs have increased notably.
An NAHB economist, Natalia Siniavskaia, wrote a blog post that looked at the Census Bureau’s Survey of Construction data and estimated that single-family lot prices remained at record high levels in 2016. She found that the median lot value reached $45,000 for the first time in 2015, exceeding the previous record of $43,000 reached in 2006—the year that the market peaked and the pace of single-family home starts was more than double the 2016 pace. Clearly, rising lot prices are a contributing factor in the relationship between inventories and home prices noted by Khater at CoreLogic and cited by Yun at NAR.
There is a strain of the economics literature that focuses on housing supply. In that literature, restrictions that limit land availability have been found to play an important role. In a 2017 paper, Glaeser and Gyourko outline what they view as “the three core facts of housing supply”:
• When building is unrestricted by regulation or geography, housing supply curves seem relatively flat, meaning that we can approximate reality by referring to a single production cost.
• Both geography and regulation severely restrict the ease of building in some parts of the country. These constraints raise building costs both directly, by increasing time delays and reducing the amount of available land, and indirectly, by ensuring the homes are produced more on a one-by-one basis rather than in bulk.
• The supply of housing is kinked and vertical downwards because housing is durable.
The first point indicates that, in a market without restrictions, as the demand for housing increases, more houses are produced and with very little increase in housing prices—the price of the home merely reflects construction costs. The kinked, downward portion of the housing supply curve (third point) is relevant when the demand for housing falls, a situation faced by cities with declining populations.
The second point may be relevant in helping explain the current situation in some housing markets. Demand is increasing, home prices are increasing—and by some accounts to the point that entry-level homes are unaffordable in some markets for middle-income households—and there is a relatively modest increase in the housing supply. Perhaps there have been additional restrictions imposed on the housing market that could help explain these dynamics.
There is some evidence that additional regulations may be a factor. Using responses from a 2016 NAHB survey where builders were asked to account for regulatory costs in the homebuilding process, NAHB economist Paul Emrath estimated in a May 2016 study that “on average, the regulations imposed by government at all levels account for 24.3 percent of the final price of a new single-family home built for sale. Three-fifths of this—14.6 percent of the final house price—is due to a higher price for a finished lot resulting from regulations imposed during the lots development.”
In addition, he found that the share of the home price due to regulatory costs was similar when this survey was last conducted in 2011. However, this meant that regulatory costs increased substantially—by nearly 30 percent—to match the increase in home prices over that period. Emrath noted that disposable per capita income rose 14 percent over the same period and remarked that “the cost of regulation in the price of a new home is rising more than twice as fast as the average American’s ability to pay for it.”
Regulations may be just one of many factors affecting residential construction in recent years, however. Labor availability, construction costs, and financing for land acquisition and development may also be contributing factors as well. A December 2017 survey by the Federal Reserve Bank of Atlanta found that “most builders indicated that labor and material costs had increased from the year-ago level” and “the majority of builders said the amount of available credit for construction and development remained insufficient to meet demand.” Similarly, the NAHB noted in May 2017 that while the volume of residential construction loans increased over the previous four years, “tight availability of acquisition, development and construction (AD&C) loans has been a limiting factor for home building growth.”
Have a question or comment about this article? We'd love to hear from you!
Views expressed are those of the authors and do not necessarily reflect those of the Federal Reserve Bank of Richmond or the Federal Reserve System.
Contact Us