About Regional Matters
These posts examine local, regional and national data that matter to the Fifth District economy and our communities.
These posts examine local, regional and national data that matter to the Fifth District economy and our communities.
With new variables available in the 2018 Home Mortgage Disclosure Act data, researchers can for the first time analyze mortgage application denial rates by age. This topic is relevant to the health of the economy because young adults are not buying homes at the same rate as in previous generations. The Urban Institute found that in 2015 the homeownership rate of Americans aged 18 to 34 was 8 percentage points lower than that for Gen Xers (those aged 35 to 50 years old) and baby boomers (those aged 51 to 69 years old) at the same age. Although the U.S. Census Bureau found that the homeownership rate among Americans younger than 35 has increased in recent years, in 2019 it is still nearly 20 percentage points below the rate for all Americans.
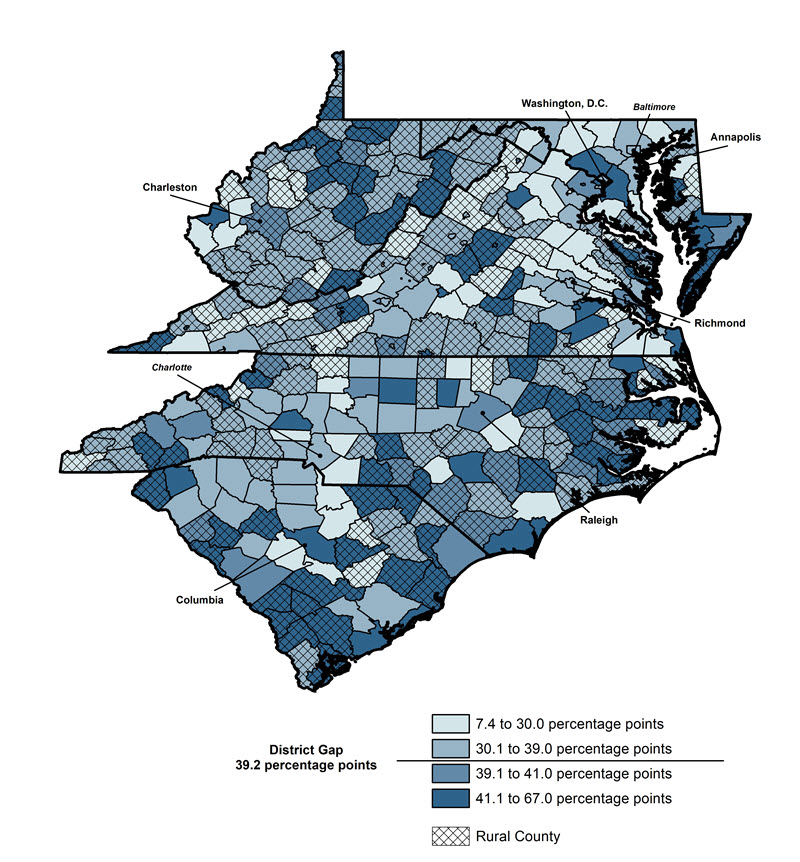
Among heads of household in the Fifth District, older adults are more than twice as likely to own a home as younger adults. In 2017, 73.4 percent of older adult heads of household (aged 35 and older) were homeowners, compared to only 34 percent of younger adults (those aged under 35), for a homeownership gap of 39.2 percentage points. Within counties in the Fifth District, however, the homeownership rate gaps between older and younger adult heads of households vary widely. As shown in the map below, in 2017 the homeownership gap between older and younger adult heads of household ranged from 7.4 percent in Amelia County, Va., to 67.0 percent in McCormick County, S.C.
Additionally, the data suggest the gap is higher in rural counties in the Fifth District than in urban counties. Twenty-seven percent of urban counties in the Fifth District have a homeownership gap above the districtwide level of 39.2 percentage points, compared to 39 percent of rural counties. Overall, the young adult homeownership gap for heads of households in rural counties throughout the Fifth District is 1.8 percentage points above the young adult homeownership gap in urban counties. See map below.
Part of the gap in homeownership may be due to differing preferences between the average young adult and older adult. According to a 2018 study by the Urban Institute, young adults tend to prefer living in cities with more expensive housing, so they could be delaying homeownership until they can afford the higher price tags. However, this does not fully explain why young adults’ homeownership would be relatively lower in rural areas. In fact, some evidence has suggested that differences in young and older adults’ homeownership rates may be partly because lenders deny young adults’ loans more frequently than older applicants.
A 2017 survey by NerdWallet, for example, found that millennials were three times more likely than baby boomers to be denied a mortgage and drop out of the application process. A survey conducted in 2019 by YouGov for Bankrate.com found that 13 percent of adults aged 23 to 38 have been rejected from a mortgage loan based on their credit score, compared with 10 percent of those aged 39 to 54 and 4 percent of those aged 55 to 73. If lenders are denying young adults more frequently than older adults, the reasons behind those denials could identify opportunities to improve credit conditions for young Americans seeking to own a home.
2018 Mortgage Denial Rates in the Fifth District
According to the latest HMDA reporting data, young adults’ experiences with mortgage denials are more nuanced than previous data have suggested, with differing outcomes among those living in urban and rural communities. The following figure shows denial rates in 2018 for applicants of conventional loans on single-family, 1-4 unit homes, broken out by applicant age. The data show that denial rates did not differ significantly between young and older adults within most Fifth District states overall. As evident in the chart, in 2018 denial rates were actually lower for younger applicants in the District of Columbia, Maryland, and Virginia. The opposite was true in South Carolina and West Virginia, however: in those states, denial rates were 5 percentage points higher for younger adults than for older adults.
Within rural counties in Fifth District states, however, the results are less ambiguous. Adults younger than 35 were at least 4 percentage points more likely to have their mortgage applications rejected in rural counties in Fifth District states. In South Carolina, the difference is particularly stark: 37 percent of applicants under the age of 35 had their mortgage applications rejected in 2018, compared with 27 percent of those 35 and older – a 10 percentage point difference. Within urban counties, differences were significantly smaller: The denial rate for younger adults did not exceed 1.7 percentage points above that for older adults in the urban regions of any state.
Reasons for Mortgage Denial
What accounts for these differences in denial rates within rural Fifth District counties? Some answers might be found in lenders’ stated reasons for denying applications. The chart below shows the breakdown of stated reasons for young and older adults’ mortgage application denials in rural areas (lenders are able to provide up to four reasons why they deny mortgage applications, so the data add to more than 100 percent). Over half (51 percent) of younger adults who were denied mortgage applications in rural counties were denied because of their credit histories; in contrast, 44 percent of older adults had their applications denied due to credit history, a 7 percentage point difference. Still, credit history is the most common reason for denial among adults in both age groups. Applicants’ debt-to-income ratio is the second-most common explanation for adults in both age groups.
Credit history is a particularly salient issue for applicants in South Carolina, where, as previously shown, denial rates were high in 2018 for both older and younger adults, but where denial rates were particularly high for younger adults. As shown in the chart below, 55 percent of older adults who had their credit applications denied were rejected because of their credit history, compared to over two-thirds (68 percent) of younger adults. While credit history disproportionately impacts young adult applicants in rural North Carolina, Virginia, and West Virginia counties, nowhere else in the district is the difference between older and younger adults as stark as in rural South Carolina.
Unlike in rural counties, credit history was not the top reason for mortgage denial in urban areas. As shown in the chart below, the most common reason applicants in urban counties were denied mortgage loans in 2018 was their debt-to-income ratio. Thirty-three percent of younger adults and 36 percent of older adults who were denied were rejected for this reason. In contrast, 29 percent of younger adults’ denials and 27 percent of older adults’ denials were due to credit history.
Conclusion
While it is not clear from the 2018 HMDA data that disproportionate denials are driving lower rates of home purchasing among younger adults in all parts of the Fifth District, it is evident that young adults in rural communities in the Fifth District face unique borrowing burdens that may be limiting homeownership levels. Primary among these burdens is their credit history, which was cited as a reason for denial more often for younger applicants than older applicants in rural communities. Efforts to improve credit health in rural areas therefore could benefit homeownership outcomes for young borrowers in these communities.
Have a question or comment about this article? We'd love to hear from you!
Views expressed are those of the authors and do not necessarily reflect those of the Federal Reserve Bank of Richmond or the Federal Reserve System.