Rural-Urban Health Disparities in the Fifth District Before COVID-19
Introduction
The COVID-19 pandemic has challenged the health care infrastructure and highlighted rural-urban disparities in health and health care access across the country. It has also reinforced the critical role that a healthy workforce and robust health care infrastructure play in a community’s economic growth and stability. Prior to the pandemic, many rural communities had been disproportionately impacted by health care workforce shortages along with social and economic barriers to health relative to urban communities. Rural hospitals, which often serve as important economic drivers and anchor institutions, have been closing or reducing services in areas that already faced barriers to health and health care access. Recognizing health-related differences that predated the pandemic could help rural and urban communities develop strategies to leverage community assets to support community and economic health. In anticipation of the Richmond Fed’s Rural America Week, culminating in the Investing in Rural America Conference on October 8, this Regional Matters post examines the 2020 RWJF’s County Health Rankings data to understand how health drivers in Fifth District rural and urban counties compared prior to the pandemic and how the impacts of COVID-19 may shift the landscape.
RWJF County Health Rankings & Roadmaps
The County Health Rankings & Roadmaps program is a partnership between the RWJF and the University of Wisconsin Population Health Institute. Using a population health model that incorporates the wide range of factors that influence health outcomes, the team produces annual health rankings of counties within each state along with resources for stakeholders to address the health-related needs in their communities.
Each county receives two primary rankings within their respective states, which are calculated from variables that have been standardized and weighted into subrankings. (See table below.) Health Outcomes represent a community’s current health through length and quality of life metrics. Health Factors represent the determinants of health and is designed to highlight opportunities for communities to address in order to improve future health outcomes.
| County Health Rankings | Weight - Subranking |
| Health Outcomes |
|
| Health Factors |
|
The 2020 County Health Rankings use data largely from 2016-2019, with some exceptions. The County Health Rankings team publishes the county-level data used in the ranking calculations along with supplementary measures of health factors and outcomes that were not included in the rankings calculations but provide additional information on community characteristics that drive health.
How Do Rural and Urban Counties Rank in the Fifth District?
We analyzed the 2020 County Health Rankings for the counties and county-equivalents in Maryland, North Carolina, South Carolina, Virginia, and West Virginia. Using the U.S. Department of Agriculture’s 2013 Rural-Urban Continuum Codes with the County Health Rankings, we categorize each county as urban (Metro codes 1-2) or rural (Metro/Non-Metro codes 3-9). Using this categorization, 215 counties are classified as rural, and 143 are urban. In addition to numerical rankings, the County Health Rankings data include each county’s quartile within its state for each of the rankings, subrankings, and underlying measures. Counties in the top quartile rank highest, or “healthiest,” within their state.
Health Outcomes Rankings and Subrankings
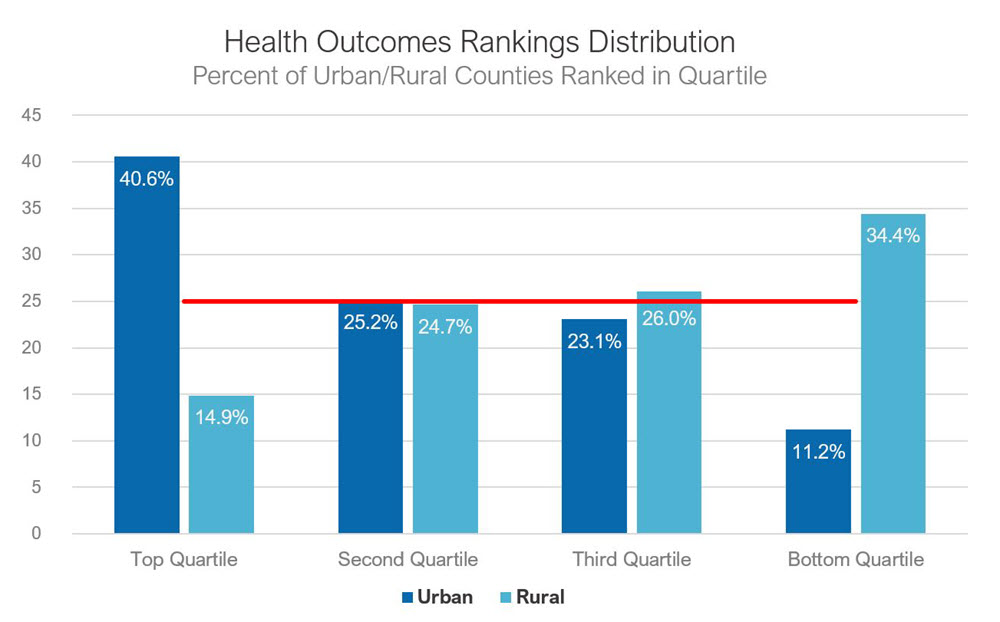
For the Fifth District overall, urban counties tend to rank higher than their rural counterparts on the health outcomes. The distribution of counties by state quartile shows that urban counties disproportionately comprise the top quartile of health outcome rankings across the district. Nearly 90 percent of urban counties in the district rank within the top three quartiles within their respective states. (See chart below.)
Life Expectancy at Birth (Years) | ||||||
Highest County | State County Median | Lowest County | ||||
Urban | Rural | Urban | Rural | Urban | Rural | |
Maryland | 84.4 | 81.4 | 78.7 | 78.7 | 72.8 | 75.9 |
North Carolina | 82.1 | 82 | 77.4 | 76.6 | 75.2 | 73.2 |
South Carolina | 79.8 | 82.6 | 77 | 74.2 | 73.6 | 67.5 |
Virginia | 92.5 | 83 | 78.5 | 76.4 | 67.9 | 67.5 |
West Virginia | 77.6 | 79.1 | 74.7 | 75.9 | 71.4 | 68.6 |
Source: 2020 County Health Rankings; author's calculations
Health Factor Rankings and Subrankings
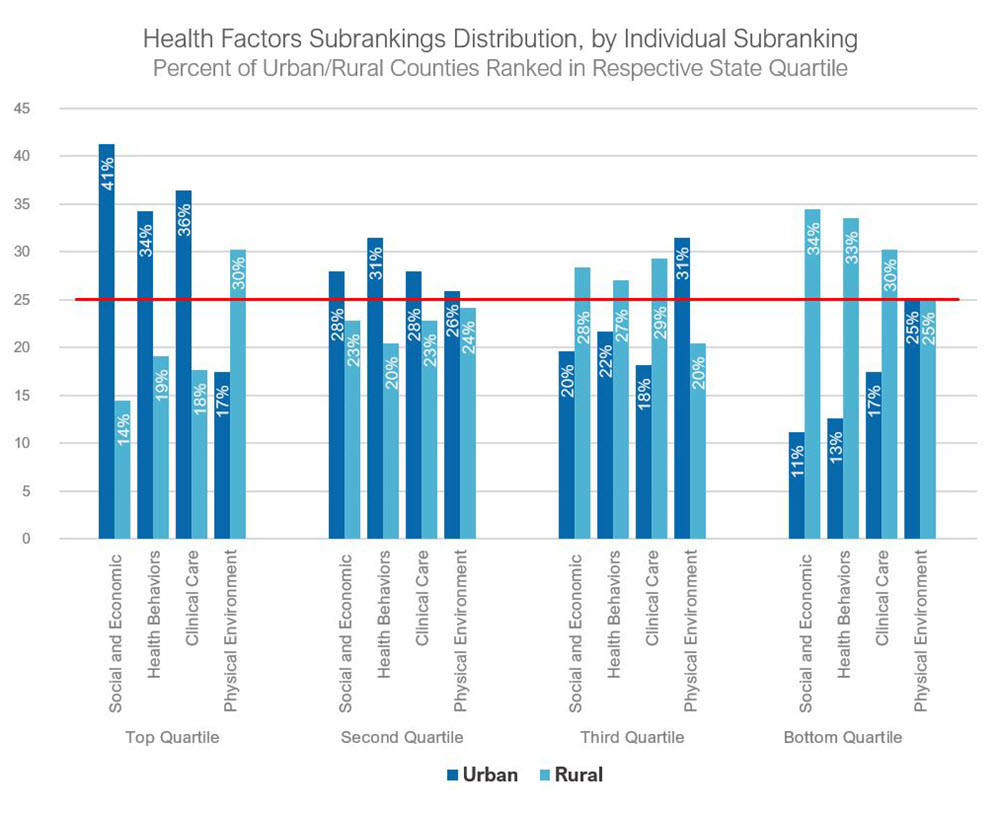
The distribution of rural and urban counties for the overall health factors rankings follows closely with the health outcome rankings, but urban counties represented a higher share (41 percent) of their states’ top quartile. Only 14 percent of rural counties in the district ranked in their state’s top health factors quartile, though the distribution varied by state. Maryland had the most even distribution across the quartiles, and South Carolina’s distribution favored urban counties more than the other states. The urban-rural distribution varied across the underlying health factor subrankings for all counties combined across Fifth District states. (See chart below.)
Conclusion
The COVID-19 pandemic has impacted community health and economic outcomes in rural and urban communities across the district. The RWJF County Health Rankings data are a valuable resource in understanding health disparities and opportunities for improvement within states. In the Fifth District, rural counties tend to rank lower across health outcomes and factors, but some rural communities outperform urban counties on key measures, and there is significant variation in the rural-urban gap between states. The rankings can guide researchers, policymakers, and stakeholders toward key issue areas, but targeted action requires a closer look at the individual health drivers and their differential effect on communities. While some of the underlying data sources include racial and ethnic subgroupings, county-level data provide little direct insight into socioeconomic, racial, and spatial disparities within counties. Comparing rankings across broad geographic designations mask significant variation along the urban-rural continuum, but additional community level data and insight can help contextualize community strengths and opportunities. A barrier to health that is quantitatively similar in two counties may be experienced differently in a rural and an urban county, or in two rural communities with different geographies and economic drivers. Solutions to a common problem may require different programs, policy levers, and resource channels in diverse communities. As data become available on the health and economic impacts of COVID-19, understanding pre-pandemic health-related strengths and vulnerabilities could provide insight into recovery and build resiliency for rural and urban communities in the Fifth District.
Have a question or comment about this article? We'd love to hear from you!
Views expressed are those of the authors and do not necessarily reflect those of the Federal Reserve Bank of Richmond or the Federal Reserve System.


