Unlocking Housing Supply: What Can We Learn About Recent Construction and Permitting Patterns in Our Region?
Introduction
Since 2020, housing has become increasingly unaffordable for many families throughout the United States. Nationally, home prices have risen more than 40 percent, on average, and rent has increased by around 22 percent. While heightened demand likely fueled the rapid buildup in home prices since the COVID-19 pandemic, a chronic undersupply of housing from underbuilding in the 2010s also contributes to current housing affordability challenges.
Recent rates of new residential construction have varied considerably across communities. This can be due to a variety of factors, such as the availability and cost of developable land, the cost of materials, the availability of skilled labor, and the attractiveness of the local housing market. Local regulatory policies and frameworks, such as land use and zoning laws, environmental regulations, and public participation in the permitting process, also affect the extent to which developers can respond to strong demand for new housing.
Land availability and regulations can play a part in explaining differences in the local supply of housing.
Recent and Expected Housing Supply Growth in the Fifth District
The number of permits issued for new residential construction is a leading indicator for housing starts and completions, since new construction almost always requires a building permit. Meanwhile, the number of housing units measures current housing availability. Newly constructed units add to the housing supply, but those gains are offset by a loss of units.
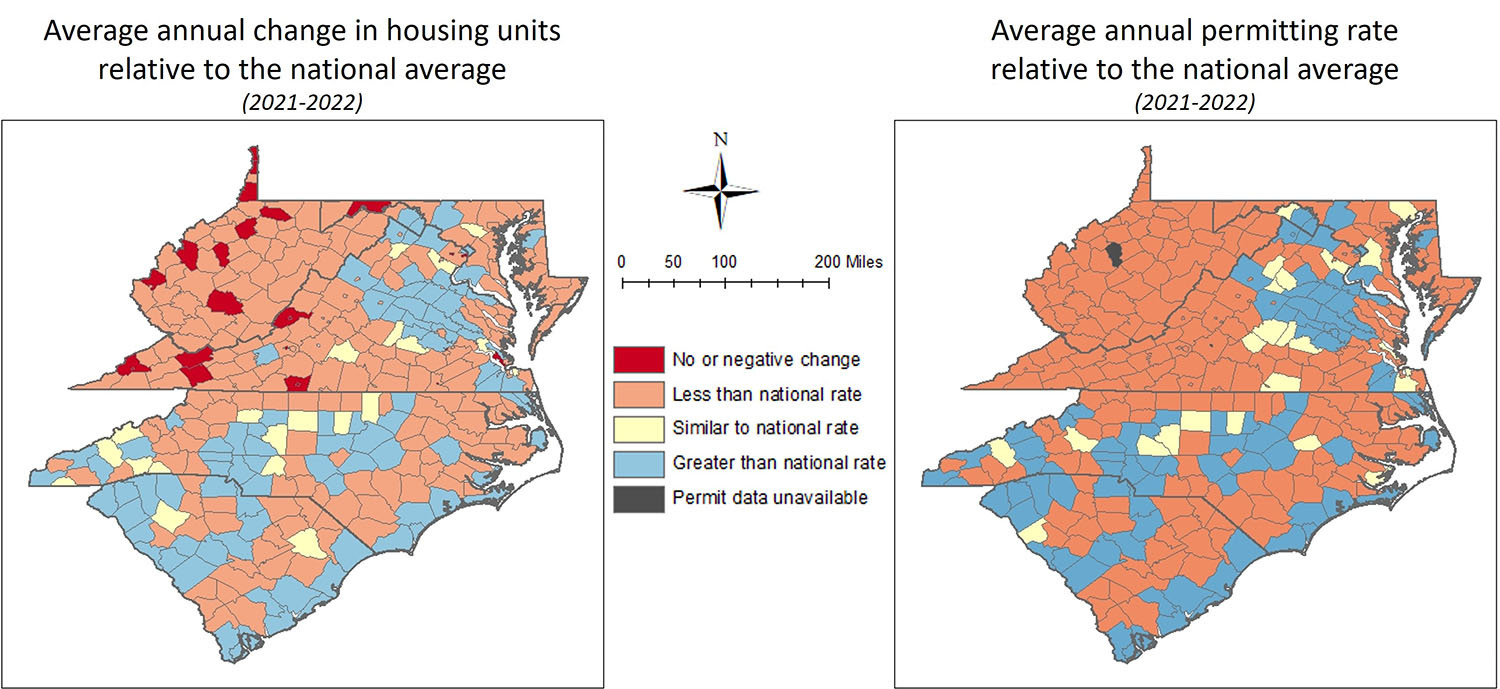
Fifth District counties that experienced relatively high housing supply growth in recent years also had relatively high permitting rates. Many of the counties that experienced greater housing supply growth and permitting rates than the national averages in 2021-2022 are in or near metropolitan areas in central Virginia and the Carolinas: Richmond, Charleston, Charlotte, Raleigh-Durham, and Wilmington. Conversely, few counties in West Virginia and Maryland experienced recent housing supply and permitting growth rates similar to or greater than the nation. (See maps below.)
Local Regulations Influencing Housing Supply
Differences in local regulation across Fifth District counties contribute to the variation in both housing supply growth and permitting rates. In addition to economic factors, local regulation influences both development costs and feasibility. Recent research finds that more complex regulatory processes are associated with longer development project delays and higher home values. The most significant regulatory practices in more restrictive communities, which tend to be concentrated in the Northeast Corridor and on the West Coast, include (among others):
- Approval from a greater number of entities.
- More public and local official involvement in the local residential development process.
- Larger minimum lot sizes.
The authors report land use regulation indices for 44 U.S. core-based statistical areas (CBSAs), constructed by averaging the survey responses of their individual municipalities. Two of the CBSAs are in the Fifth District: Washington, D.C., and Charlotte, North Carolina. With respect to development, in their sample, communities in the Washington region are among the most highly regulated, while those within Greater Charlotte are some of the most lightly regulated.
Places with more intensive regulations tend to have lower rates of new construction. In these cases, research has found that housing starts respond more slowly to housing price increases. This means that developers will be less responsive to demand signals, which can exacerbate local housing shortages. These effects result in increased housing costs and depressed land values for residents.
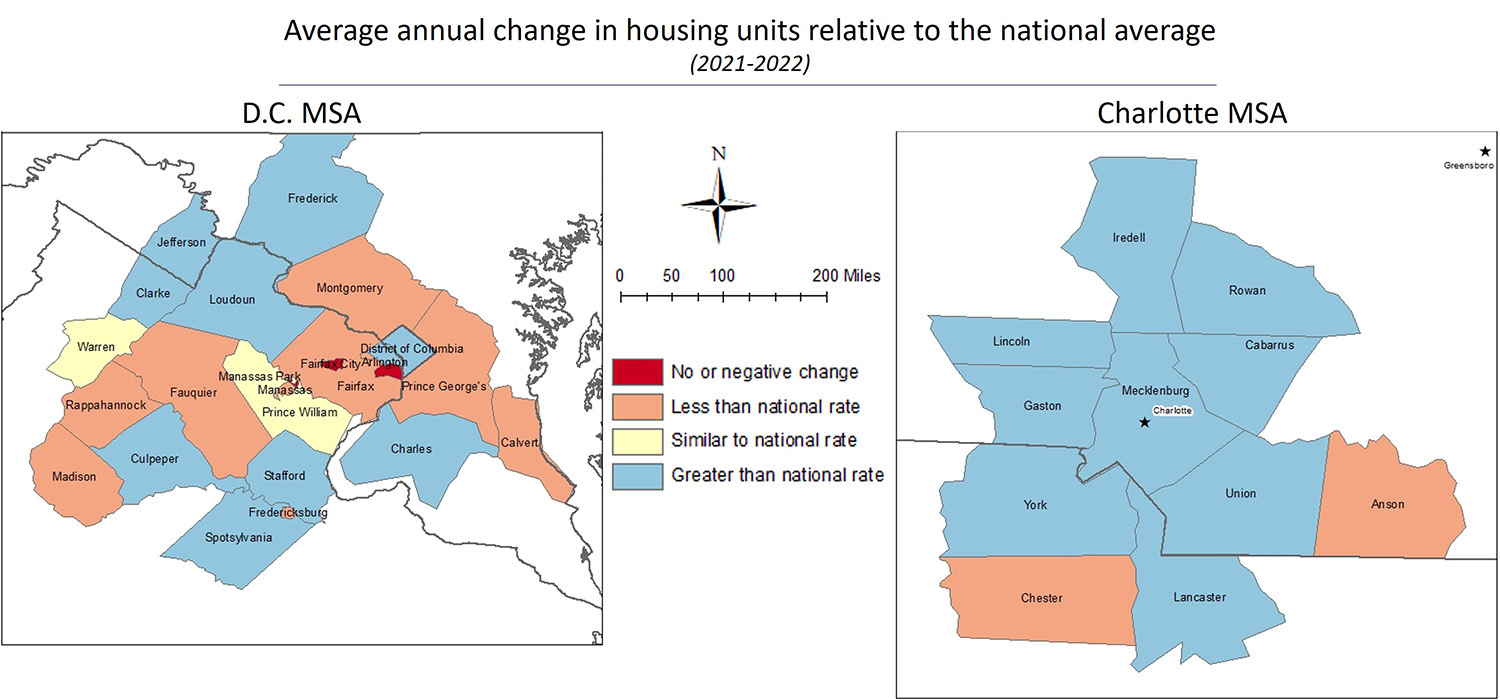
Recent housing supply growth in the D.C. and Charlotte MSAs aligns with these findings. Overall, the D.C. MSA housing supply grew more slowly than the national average, and the Charlotte MSA grew more rapidly, although individual counties within each metro area varied. (See maps below.)
These differences result from longer-term differences in permitting between the two metropolitan areas. The Charlotte MSA's less strict regulatory environment makes it easier for developers to obtain permits. As a result, the Charlotte MSA's permitting rates have consistently remained above the national average over the past decade, while the D.C. MSA's have been more in line with national trends.
Confronted with higher housing prices and increasing competition in both the rental and homeownership markets, most Americans support regulatory reforms that would increase the housing supply, such as expediting the permitting process or allowing for greater housing density. Recently, there have been successful efforts to relax zoning restrictions with the intent of achieving greater housing affordability within Fifth District communities.
A Tale of Two Maryland Counties: Frederick and Talbot
While variation in land use regulation helps explain some of the differences in housing supply growth and permitting, other local characteristics also influence both policy and development decisions. One study found that places with stricter regulations often face geographical constraints that limit the availability of developable land, such as steep-sloped terrain or water features. On one hand, this relationship might explain the reason for stricter regulation: When land is scarce, local homeowners will be incentivized to protect their property investment, and regulators will be more selective when approving new development. But from the developer's perspective, both a lack of available land and more intensive regulatory processes will add to the cost of production, thus potentially further limiting the supply of new housing.
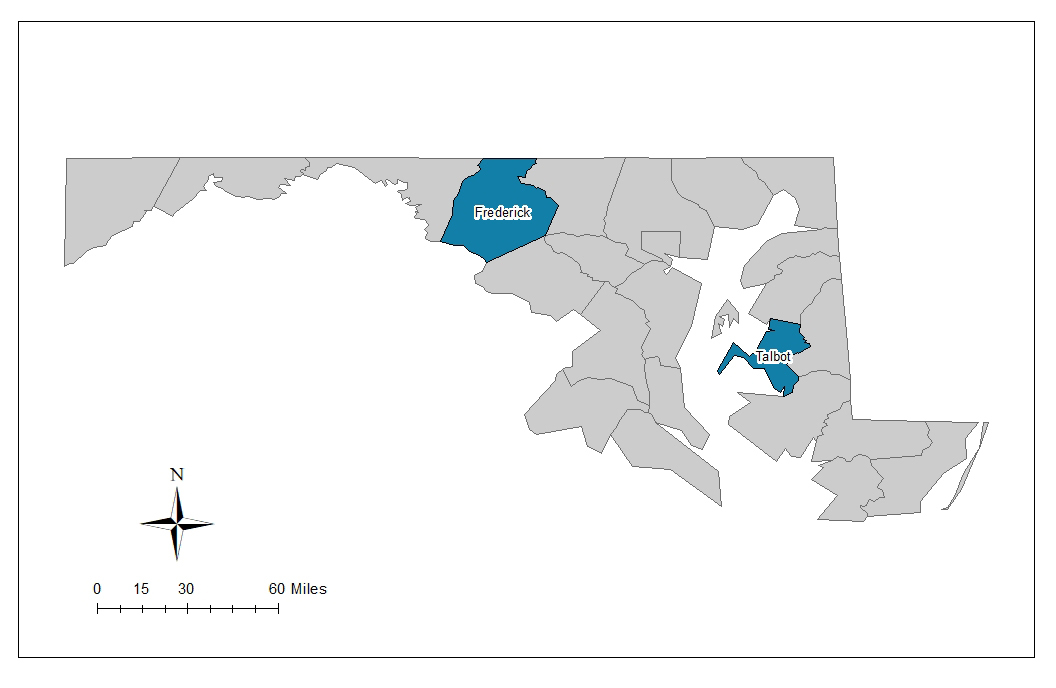
In Maryland, Frederick and Talbot counties have had divergent experiences in recent population growth and permitting activity, demonstrating how both the availability of land and the intensity of land use regulations can impact local supply.
Fifty miles northwest from the nation's capital, Frederick County is one of the fastest growing counties in Maryland by population (23 percent since 2010). It is the state's largest county by land area with much of it encompassed by open rolling agricultural lands. As an exurb of Washington D.C., Frederick County's growth of permitting and new housing units were both above the national rate in 2021-2022 to accommodate the increasing number of in-migrants from D.C. and its inner-ring suburbs. Frederick County Councilman Steve McKay attributes recent rapid development in part to a temporary change in the process for development approval in 2012, which relaxed regulations for developers.
Talbot County, one of Maryland's smallest counties by land area, is located on the eastern side of the Chesapeake Bay. The county has experienced little to no recent change in population (less than 1 percent since 2010), and its growth rates for permitting and new housing units were both well below the national rates in 2021-2022. This slow growth in population and housing units is not because Talbot County is an unattractive place to live — quite the opposite — its proximity to Baltimore and D.C., rural character, and abundant natural amenities make it very desirable. However, development restrictions abound due to "significant, environmentally sensitive areas including critical areas adjacent to the shoreline, prime agricultural soils, conservation easements and other habitat protection areas," according to Miguel Salinas, planning officer in Talbot County. Since 2011, it has become much less costly for environmental and community groups to legally challenge building permits over environmental impact concerns in Maryland. As an example of how this can hamper development, a major 2,500 home development in Trappe has been delayed for years due to challenges from the community over its potential environmental impacts on the Choptank River and Chesapeake Bay.
Closing Thoughts
As communities continue to face housing affordability challenges, it is important to explore strategies to boost residential development and alleviate upward pressure on housing prices. Fifth District counties with higher permitting rates tend to grow their housing stock more rapidly. Comparing the Charlotte and D.C. MSAs suggests that looser land use regulation is one of the factors that contributes to both permitting and construction of new units. Revising permitting processes and land use policies are two opportunities to promote new residential construction that have received growing public support in recent years.
Views expressed are those of the author(s) and do not necessarily reflect those of the Federal Reserve Bank of Richmond or the Federal Reserve System.


