Federal Government Transfers in the Rural Fifth District
Regional Matters
June 20, 2025
In previous articles, we articulated the role that cuts in federal government workforce and spending might have on the Washington, D.C., region of the Fifth Federal Reserve District. But another key piece of federal government spending that impacts our Fifth District communities is transfer payments. For many households in the Fifth District, transfer payments from the government comprise a sizable share of personal income. Whether it be medical benefits, social security, or unemployment insurance, transfer payments serve as a tool for both poverty alleviation and household financial stability. The degree of reliance on government transfers varies widely across Fifth District geographies. Particularly, there are notable differences between rural and urban spaces, primarily due to income and demographic differences.
What Is the Composition of Transfer Payments?
Transfer payments redistribute income to households through various channels and social programs. While the source of these payments can vary, a vast majority of transfers are awarded through federal government programs. Transfer payments are also distributed through nonprofits and businesses, though they comprise a much smaller share of total personal income. Many of these programs are means-tested i.e., the recipients must meet certain income/financial eligibility requirements to target households with the greatest need.
The composition of transfer payments in the Fifth District are roughly1 on par with the rest of the United States. Most transfers in the Fifth District are medical benefits, including Medicare, Medicaid, and military health benefits, which comprised roughly 40 percent of total transfers in 2023. Retirement benefits are another large component of transfer payments (mostly Social Security income), comprising roughly 30 percent of total transfers. Income maintenance benefits such as Supplemental Security Income (SSI), Supplemental Nutrition Assistance Program (SNAP), and Temporary Assistance for Needy Families (TANF) comprise roughly 10 percent of total transfers. Other transfer payments which comprise a much smaller share of personal income include veterans benefits, education and training assistance, refundable tax credits, and transfers from nonprofits and businesses. Lastly, unemployment insurance compensation comprises less than 1 percent of total transfers but are most subject to increase during recessionary periods.
Transfer Payments Differ Widely Across Fifth District Geographies
In the Fifth District, transfer payments as a share of total personal income have been roughly on par with the rest of the United States over the past decade. More recently, the Fifth District has pulled slightly above the United States; however, reliance on transfer payments differs among states, with West Virginia households having notably higher contributions from transfer payments compared to other Fifth District states. Conversely, D.C., Maryland, and Virginia households rely less on transfer payments relative to the rest of the United States.
There are also differences in contributions from transfer payments between urban and rural geographies in the Fifth District. Transfers as a share of income vary from 5 percent in Arlington, Va., to 53 percent in McDowell, W.Va. On average, individuals in rural2 counties derive 29 percent of their personal income from transfer payments compared to 17 percent in urban counties, a pattern that is evident at the national level as well3. Transfer payments are over 40 percent of personal income in only two urban counties in the Fifth District; this gap in reliance on transfer payments between urban and rural spaces has widened over time.
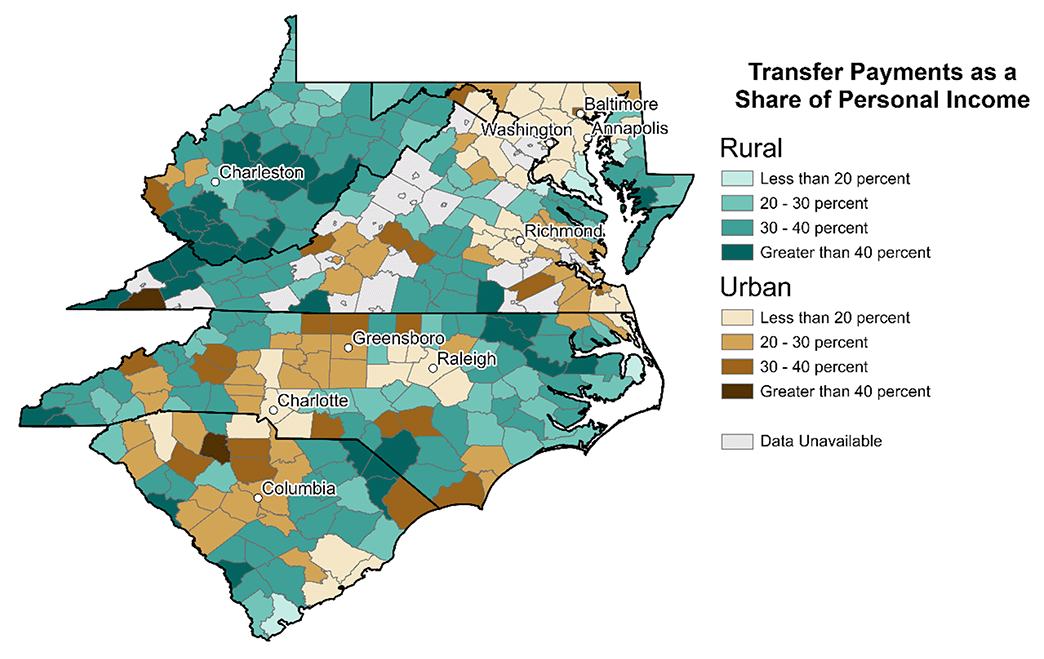
Transfer payments across the continuum of rurality can be examined through use of the Rural-Urban Continuum Code (RUCC)4 codes from the U.S. Department of Agriculture. Reliance on transfers as a share of personal income ranges between 14 percent for the most urban counties in the Fifth District (RUCC 1) to 36 percent in the most rural (RUCC 9). There is a mostly consistent relationship between the degree of rurality and the share of income that households receive from transfers. Interestingly, counties classified as RUCC 5 deviate from the trend and have notably lower shares of transfer payments compared to counties classified as RUCC 4. This is true at the national level too, though very few counties in the Fifth District fit this category.
Why Do These Differences Exist?
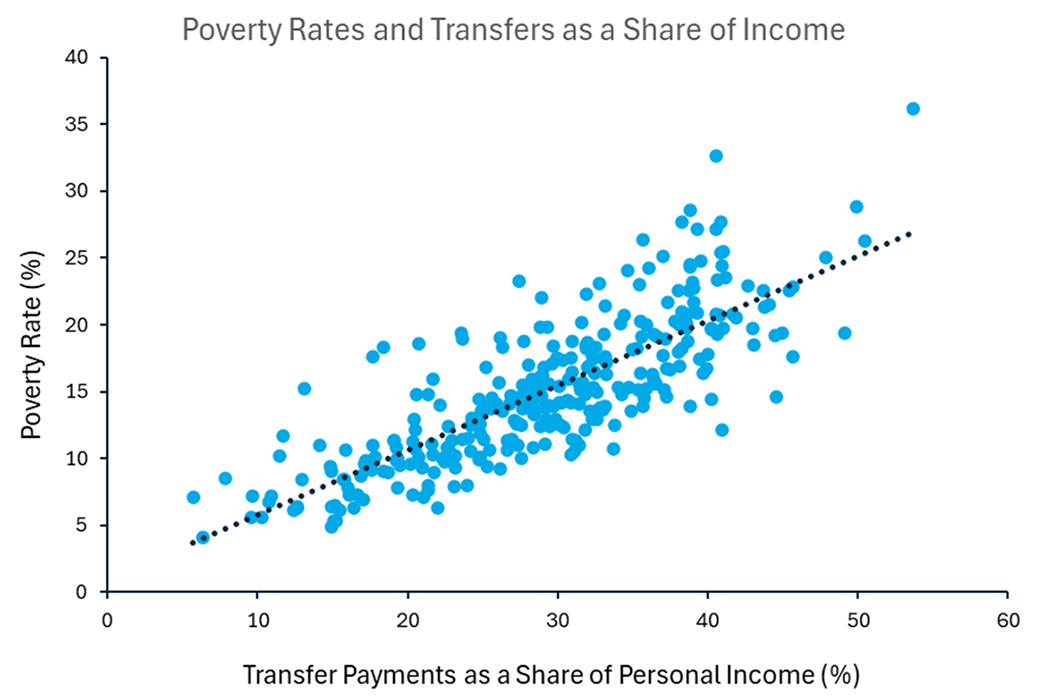
The type of transfer payments that are prevalent in an area can provide information about the underlying factors driving regional differences. For example, a higher share of personal income derived from Social Security and Medicare payments suggests more retirees. More contributions from Medicaid and income assistance benefits indicate a higher share of low-income households. Indeed, charts 3 and 4 indicate that Fifth District counties with higher poverty rates and higher shares of a 65+ population tend to have higher shares of income from transfer payments.
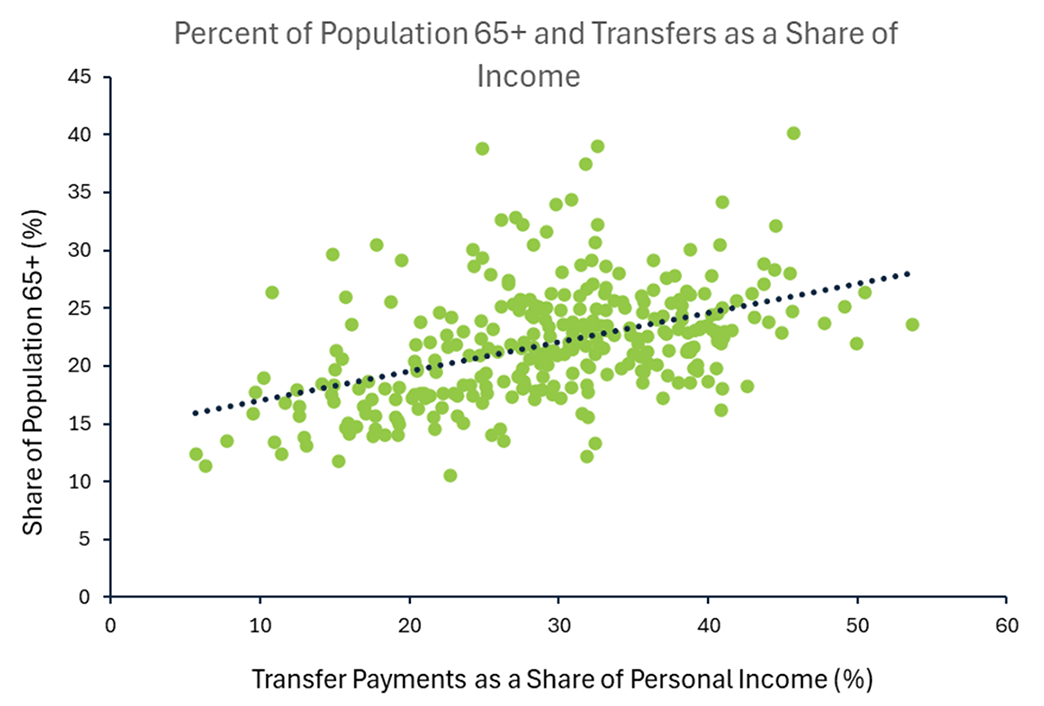
In rural areas, both factors are at play: The average percentage of residents that are over 65 years old in the Fifth District is 23 percent, compared to 19 percent in urban counties, and the average poverty rate in rural areas is 17.2 compared to 11.7 percent in urban counties. This higher share of transfer payments reflects some of the challenges that exist in these localities — smaller working age populations, fewer employment opportunities, and less access to higher wage occupations — all of which prevent households from deriving a higher share of their personal income from work earnings.
How May Reliance on Transfer Payments Evolve Over Time?
The share of transfer payments derived from personal income was relatively stable over the last decade but spiked temporarily in 2020 and 2021 due to the economic fallout of COVID-19. Additional unemployment insurance benefits and other transfers such as economic impact payments increased total transfer payments to households by roughly 30 percent in the Fifth District, increasing the share of personal income from transfers by 4 percentage points. That unprecedented rise has since dissipated, but, at the end of 2023, the share was still above its pre-pandemic level — up by 1.5 percentage points in urban counties and 2 percentage points in rural counties. The share of transfers has been notably elevated in rural Virginia: In 2023, it was still almost 4 percentage points above its 2019 level.
With an aging population, a trend toward an increased reliance on transfer payments may be inevitable. However, recent reports show that the median age is actually declining in some rural areas, which might reduce the need for government transfers in those areas. Of course, in both urban and rural areas, a focus on labor force participation among the working age population and attracting more high-paying work could enable communities to reduce their reliance on government transfers as well as support increased economic mobility.
1
Veterans benefits comprise a slightly higher share of total transfer payments in the Fifth District compared to the rest of the United States.
2
We define rural counties as having a RUCC code of 3, 4, 5, 6, 7, 8 or 9.
3
White, Mark. "The Contributions of Government Transfer Payments to Personal Income." farmdoc daily (14):18, Department of Agricultural and Consumer Economics, University of Illinois at Urbana-Champaign, Jan. 26, 2024.
4
Definitions for each RUCC code can be found here.
Views expressed are those of the author(s) and do not necessarily reflect those of the Federal Reserve Bank of Richmond or the Federal Reserve System.
Contact Us