The Foreign-Born Workforce in the Fifth District
Regional Matters
September 4, 2025
Introduction
In recent years, foreign-born workers have played an important role in shaping regional labor market dynamics. After travel restrictions created a lull in international immigration during the height of the COVID-19 pandemic, a subsequent surge in international immigration grew the foreign-born labor force to a level that exceeded previous trend growth in the U.S. and the Fifth District (Chart 1). The increased number of foreign-born workers helped to ease labor market tightness and even shifted how we think about key labor market metrics. Across the Fifth District, the implications of changes in the foreign-born workforce will differ, as there are notable differences in the concentration of these workers across industry and geography — including across rural and urban spaces.
The Foreign-Born Labor Force has Made Outsized Contributions to Overall Labor Force Growth in the Fifth District
By definition, foreign-born workers are individuals who reside in the United States but were not U.S. citizens at birth. This includes both citizens and non-citizens — naturalized citizens, permanent residents, temporary visa holders, refugees, and undocumented immigrants. According to Current Population Survey (CPS) estimates, over the past decade, these workers have contributed to roughly 50 percent of the Fifth District's total labor force growth, though they currently comprise only 17 percent of the labor force.
The American Community Survey (ACS) also has estimates of the foreign-born labor force, and these generally have smaller margins of error due to their larger sampling of households and higher response rates. These data also show an increase in the foreign-born labor force, though the magnitude of the estimates of the foreign-born labor force have been noticeably smaller than CPS estimates beginning in 2015. Despite these differences, between 2019 and 2023, the foreign-born labor force grew approximately 11 percent in the Fifth District in both the CPS and ACS estimates. (West Virginia is excluded from Fifth District totals due to small sample sizes.)
Since foreign-born labor force growth has exceeded that of native-born workers, their share of the total labor force has increased over time. According to the ACS, in 2023, the share of foreign-born workers in the labor force ranged from 8 percent in South Carolina to 22 percent in Maryland. (According to CPS estimates, foreign-born workers comprise roughly 2 percent of the labor force in West Virginia.) Most states have seen an increase in this share over the last decade, with the largest percentage point increase occurring in Maryland. Between 2013 and 2023, Maryland's foreign-born share of their labor force increased from 18.3 percent to 21.8 percent. During that time period, Maryland's foreign-born labor force grew by roughly 133,000 workers, or 22 percent.
Foreign-Born Workers are More Likely to be Employed in Certain Occupations and Industries
The industry and occupational profile of foreign-born workers in the Fifth District differs notably from their native-born counterparts. Foreign-born workers are widely represented across industries. However, a larger share of foreign-born workers are employed in agriculture, construction, manufacturing, transportation, warehousing and utilities, professional and business services, and leisure and hospitality. Chart 3 depicts the number of workers employed in these industries as a share of the total foreign-born and native-born workforce. The differences in industry composition between the two groups are more pronounced in some industries and differ between states. For example, in North and South Carolina, the largest difference between the two groups exists in construction, where 17 percent of foreign-born workers are employed compared to 6 percent for native-born workers. Also, there are interesting differences between states. For example, in West Virginia, most foreign-born workers are employed in education, health care, and social assistance (36 percent), which is almost 9 percentage points higher than native-born workers.
However, simply looking at industry doesn't provide information about the types of work foreign-born workers are performing. Regarding their occupation profile, foreign-born workers are more likely than native-born workers to be employed in service, natural resource, construction, maintenance, production, transportation, and material moving occupations. Conversely, they are less likely to be employed in management, business, science, and arts occupations, and sales and office occupations. In West Virginia, however, foreign-born workers are significantly more likely to work in management, business, science, and arts occupations. As mentioned before, they also comprise a much smaller share of the total labor force in West Virginia.
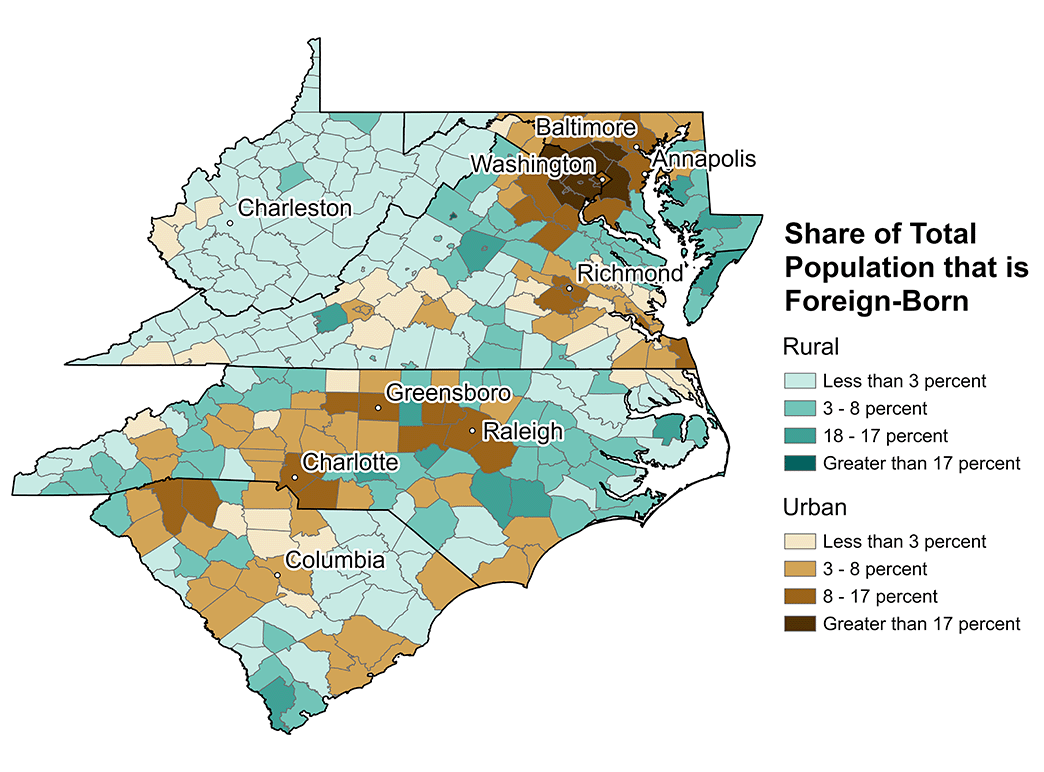
The Share of the Population that is Foreign-Born Differs by Urban and Rural Geographies
The share of the population that is foreign born also varies widely by geography, highlighting a divide between urban and rural areas. Using data from the 2023 five-year ACS estimates, Chart 5 shows the percentage of the population that is foreign born in each county in the Fifth District. On average, foreign-born individuals make up 12 percent of the total population in urban counties. The foreign-born population is most represented in the urban counties in Maryland and Virginia that make up the DMV area, with Montgomery County, Md., having the highest share (33 percent). Conversely, in rural counties, they comprise only 4 percent of the population.
However, there are some rural counties that deviate from this trend. In some cases, these counties are adjacent to urban counties that have higher foreign-born populations. But in other cases, they reflect a county's unique industry composition. For example, two counties in South Carolina's Lowcountry, Jasper and Beaufort counties, have higher shares of foreign-born workers, which coincides with a large leisure and hospitality presence in the area. In other counties, the role of agriculture and manufacturing — particularly, food processing — plays a role in their larger foreign-born population. In Samson and Duplin counties in North Carolina, foreign-born individuals are 10 percent and 11 percent of the total population, respectively, due to the significant role that meat processing plays in the area's economy. Counties such as Albemarle County, Va., and Montgomery County, N.C., have a large agriculture and food processing presence as well. In West Virginia, the county with the highest share of foreign-born workers is Monongalia County due to higher shares of education and health care employment in the area. The county is home to West Virginia's largest university and health system.
Conclusion
As overall labor force growth has slowed in many areas of our district, foreign-born workers have become an increasingly important source of labor supply. The industry profile of foreign-born workers reveals that their contributions to the workforce differ notably from their native-born counterparts. While employment opportunities may not be as plentiful in rural areas, some have a distinctive industry mix that can be a draw to foreign-born workers.
Views expressed are those of the author(s) and do not necessarily reflect those of the Federal Reserve Bank of Richmond or the Federal Reserve System.
Contact Us