
Wraparound services like transportation assistance and child care foster student success. This post highlights how some community colleges are supporting student parents.

When we started the Richmond Fed's Survey of Community College Outcomes in 2021, our primary goal was developing a metric to understand how well community colleges were performing across the Fifth District. Over the past three years, we have interacted with a wide array of community college stakeholders, learning from experts and gaining knowledge about the range of community college data that are currently available. As we wrap up our 2024 data collection and prepare to make our results public in November, this post highlights what we've done so far, what we're working on this year, and what our future plans are for the project.
In 2019 and 2020, we began increasing our outreach to community colleges across the Fifth District to learn more about how these institutions approached education and the workforce pipeline. We visited campuses across all five states in our district and met virtually with leaders from many others. There were common themes that emerged: frustrations about funding formulas, adjustments required to serve students during the pandemic, issues with the public perception of community colleges, and concerns about enrollment patterns. (See here for past posts about many of these topics.)
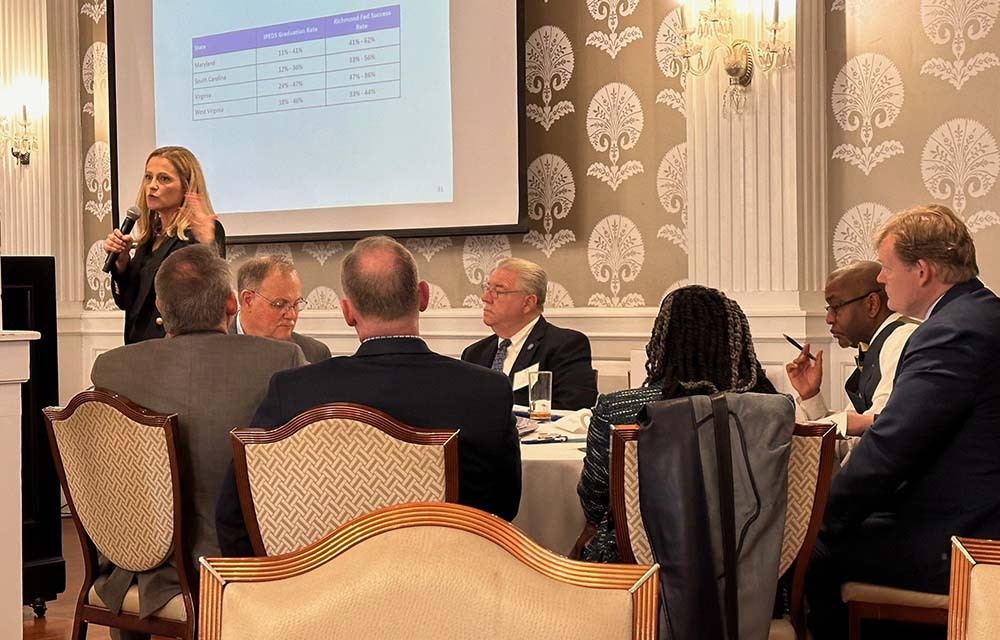
There was one issue that came up repeatedly: federal measurement (or rather mismeasurement) of what constitutes "success" at a community college. College administrators frequently criticized the way that graduation rates are calculated and the fact that the fastest growing parts of their institutions (non-credit and dual enrollment programs) are not counted in graduation rates at all.
The growth we've experienced in 2024 has been both exciting and overwhelming. We are excited to announce that we currently have data for 121 community colleges, and the survey now includes schools from all five Fifth District states.
This year will provide an opportunity to observe the success rates of the first COVID-19-era cohort: students who entered institutions during the 2019-2020 academic year. These students experienced extraordinarily unique challenges, with some starting school just weeks before having to move to a fully virtual environment. We are eager to discuss how the success of these students vary by demographics and geography.
We took the insights from our previous pilots and incorporated them into the 2024 survey. For example, we added age as a demographic so that we can observe how students across age groups experience success, and whether this varies by gender. In addition, we also separated out different types of awards (degrees/diplomas and certificates/credentials) so that we can observe shifts in success rates across different award types over time.
While we have made small adjustments to the survey, the measurement of credit, non-credit and dual enrollment remains remarkably similar to our original pilot. Significant changes, however, were made to the wraparound services portion of the data collection effort. We realized that we needed to go a bit broader and deeper in this space, and that there is considerable interest in these data beyond what we had initially expected. This year, we sent out a separate survey to student service professionals. The current response rate is close to 60 percent across the district, and we will continue to work to grow this number even further. We will have specific data on child care, transportation, food security, and parent-student wraparound services, just to name a few.
We encourage you to forward this opportunity to people you know who are interested and to also post it on social media platforms. The event is free and open to everyone.
On Tuesday, Nov. 19, we will host a public webinar to share the results from our 2024 survey. This 90-minute event will include an overview of our data as well as a conversation with two of the participating institutions.
This event will begin our communication around survey results, which will go live on our website on the same day. We look forward to presenting our findings at multiple venues in the months to come. In addition, we remain eager to collaborate with interested stakeholders in the community college and workforce spaces, and we welcome contact regarding our work.
When we started this work three years ago, we could have never anticipated the growth we have experienced. Based on communication with dozens of stakeholders, we believe that states outside of the Fifth District can also benefit from the collection of these data in their states. The more community colleges we have represented in the survey, the more research can be done, and hopefully the more policy can be created to improve student and workforce outcomes.
To this point, we have decided to expand our work nationally in 2025. We hope to expand to several states outside of the Fifth District and to grow it further in the years to come. Our team has been presenting our work at national conferences and has been communicating with community college, system and state agency leaders across the country.
The goal of our team at the Richmond Fed is to improve the pipeline from K-12 education to employment in order to improve workforce outcomes across our district and beyond. This aligns with our mandate from Congress to work toward maximum employment. Community colleges play an incredibly important role in this process, and collecting data that better tell the full story of their program or service offerings will improve the research and policy decision-making in this space.
If your community college or state organization is interested in participating in our survey, we encourage you to reach out! You can email me at laura.ullrich@rich.frb.org or you can fill out the interest form.
Views expressed are those of the author(s) and do not necessarily reflect those of the Federal Reserve Bank of Richmond or the Federal Reserve System.
Receive an email notification when a new Community College Insights article posts:
Wraparound services like transportation assistance and child care foster student success. This post highlights how some community colleges are supporting student parents.

Community colleges can leverage a number of creative strategies and partnerships to provide long-term housing solutions for the unique student populations they serve.