Shifting Populations: Results From 2021 Census Estimates
When the COVID-19 pandemic first began in the United States in 2020, many workers started working full time from home. The expansion of remote work allowed a growing number of people to see a future in which where they worked and where they lived did not have to be one in the same. As workers became less tethered to their offices in big cities, stories emerged, including from our own outreach, of workers moving away from urban cores in favor of more rural areas. But do the stories align with what the data tell us?
Each year between decennial censuses, the U.S. Census Bureau produces annual population estimates called Vintage Estimates, which include national, state, and local population estimates and components of change. The most recent county-level estimates for 2021 were released in March 2022 and capture the population changes following the onset of the COVID-19 pandemic. This post details the results of the latest population estimates and components of change in the Fifth District.
Where Are Changes in Population Happening?
The U.S. population grew only 0.1 percent between July 2020 and July 2021, the slowest annual rate in American history and on the heels of the slowest 10-year growth rate since the 1930s. (See “2020 Census: A Look at the Fifth District.”). According to the Census Bureau, slow growth in 2021 was the result of decreased immigration and fertility, as well as increased mortality due in part to the COVID-19 pandemic. Across the United States, 33 states grew in population, and 17 states and the District of Columbia lost population between 2020 and 2021. Within the Fifth District, three states (North Carolina, South Carolina, and Virginia) increased their population, and two states (Maryland and West Virginia) and the District of Columbia lost population. Overall, the Fifth District had a higher population growth rate than the United States. (See table below.)
| Level Change | Percent Change | |
| District of Columbia | -20,043 | -2.9 |
| Maryland | -7,550 | -0.1 |
| North Carolina | 93,985 | 0.9 |
| South Carolina | 59,976 | 1.2 |
| Virginia | 10,230 | 0.1 |
| West Virginia | -6,839 | -0.4 |
| Fifth District | 129,759 | 0.4 |
| United States | 392,665 | 0.1 |
Source: U.S. Census Bureau 2021 Vintage Estimates
Within each state, we can also look at population growth across urban and rural geographies. This article uses the U.S. Department of Agriculture (USDA) rural-urban continuum codes (RUCC), which breaks down counties into one of nine different categories. RUCC 1 is the most urban and refers to counties that are part of a large metro area, while RUCC 9 is the most rural and refers to counties that have very little urban population and are not adjacent to metro areas.
Over the past few decades, population growth has been concentrated in urban areas. However, between 2020 and 2021, large metro areas in the United States declined for the first time since at least 1990 (caused largely by outward migration from some of the largest urban centers including New York, Los Angeles, and San Francisco), while all other areas saw increases in population. By contrast, in the Fifth District, large metro areas grew on balance while the most rural areas tended to see population declines.
For individual states in the district, population growth varied across urban and rural categories. (See appendix below.) For example, Maryland’s large metro population fell (driven by declines in Baltimore City and Prince George’s, Montgomery, and Baltimore counties). In South Carolina, the fastest growing state in the district, metro areas grew while rural areas declined. North Carolina saw growth across urban and rural areas. It is important to note, however, that even within these urban and rural categories, there can be a large amount of variation in county population growth rates.
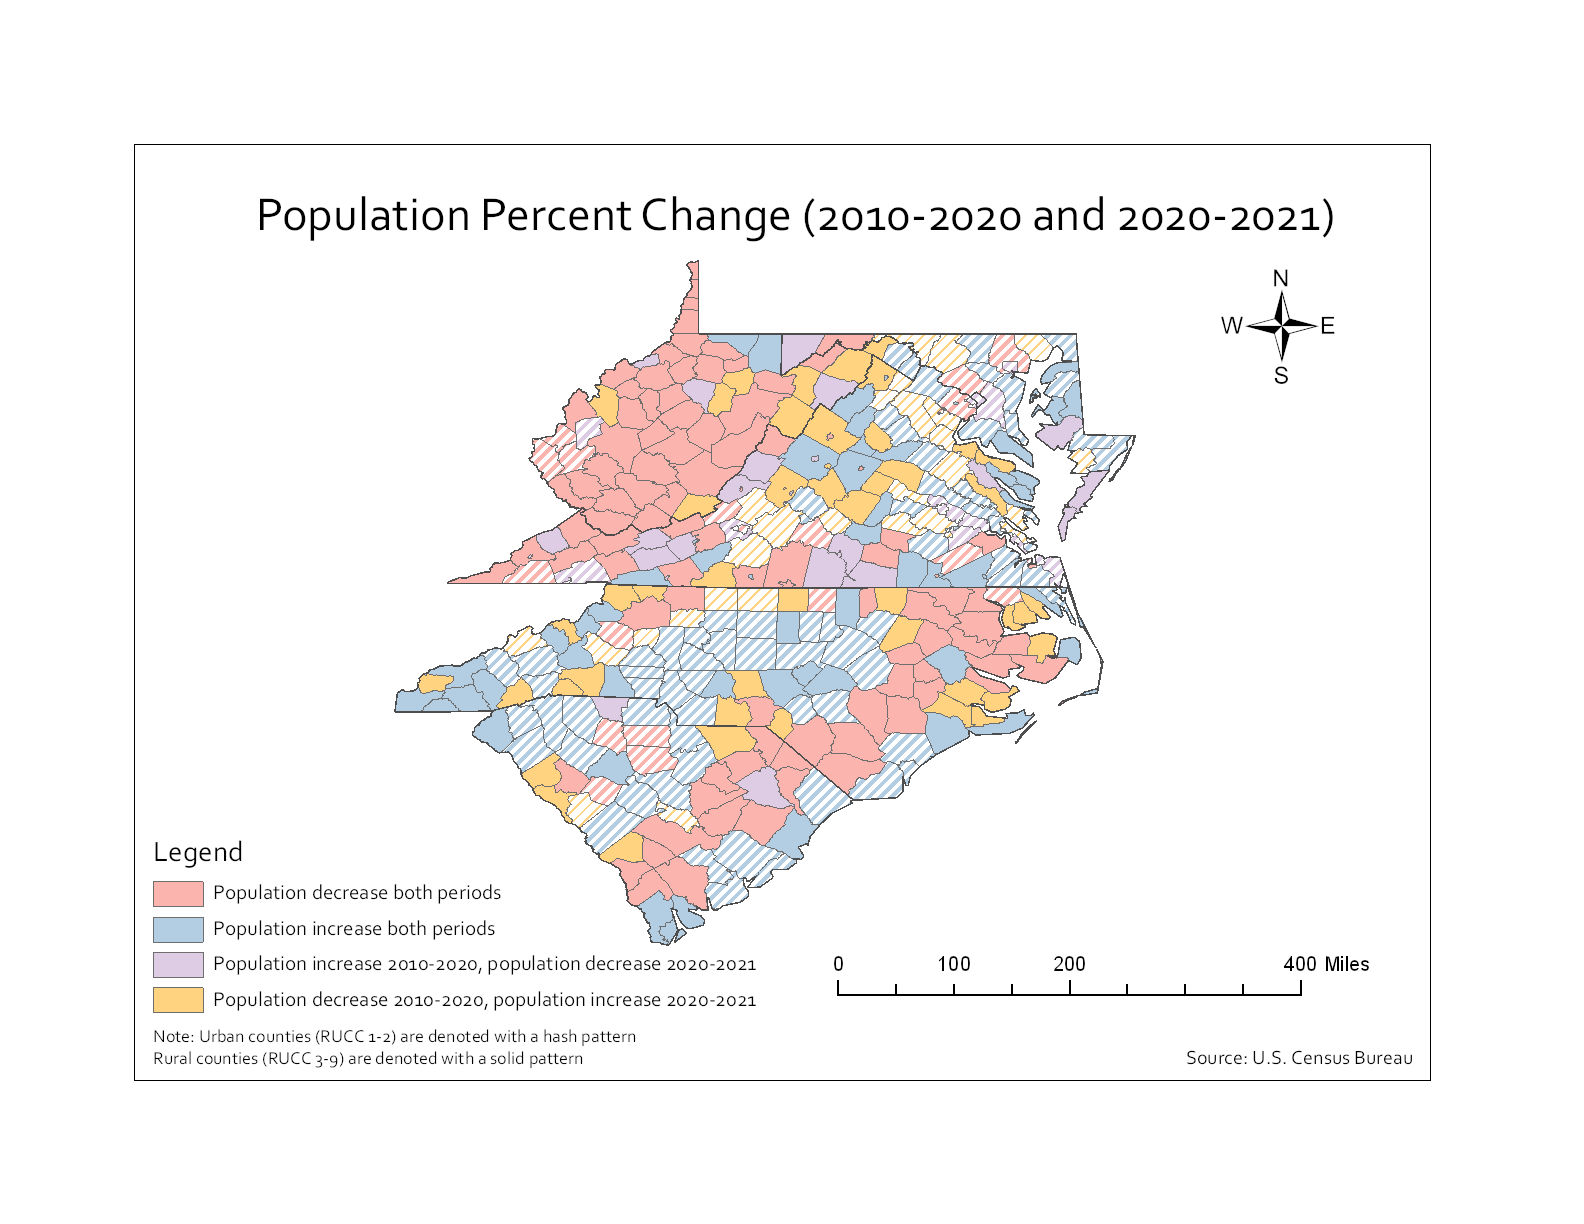
At the county level, most counties that grew in the 2010-2020 period continued to grow in 2021, and most counties that declined continued to decline. (See map below.) However, there were several counties, particularly in North Carolina and Virginia, that grew in the past year after a 10-year decline (orange counties), and many of those counties were rural. In Virginia, though, that shift was tempered by a mix of other urban and rural counties that switched from positive to negative growth (purple counties). While these shifts are generally informative, individual counties may have alternated between positive and negative growth in individual years between 2010 and 2020, and similarly, their 2021 growth rate may not persist into 2022. Official intercensal annual population changes for the 2010-2020 period are expected to be released in late 2022.
What Are the Components of Population Change?
Population change is driven by three main factors: natural change (the difference between the number of births and number of deaths), domestic migration, and international migration. From 2020-2021, most of the contributions to population growth were caused by natural change and domestic migration; international migration did not play a large role. At the national level, large metro areas declined due to outward migration. All other areas increased in population due to migration. Meanwhile, natural changes contributed positively to population in large metro areas while rural areas had negative rates of natural change.
At the state level in the district, there were variations in the components of change that contributed to population gains and losses. (See appendix below.) For example, the population loss in the District of Columbia and Maryland was driven by outward domestic migration from urban areas, whereas the increase in population to North Carolina was caused by inward migration to both urban and rural areas. In West Virginia, the state lost population overall due to natural declines across urban and rural areas.
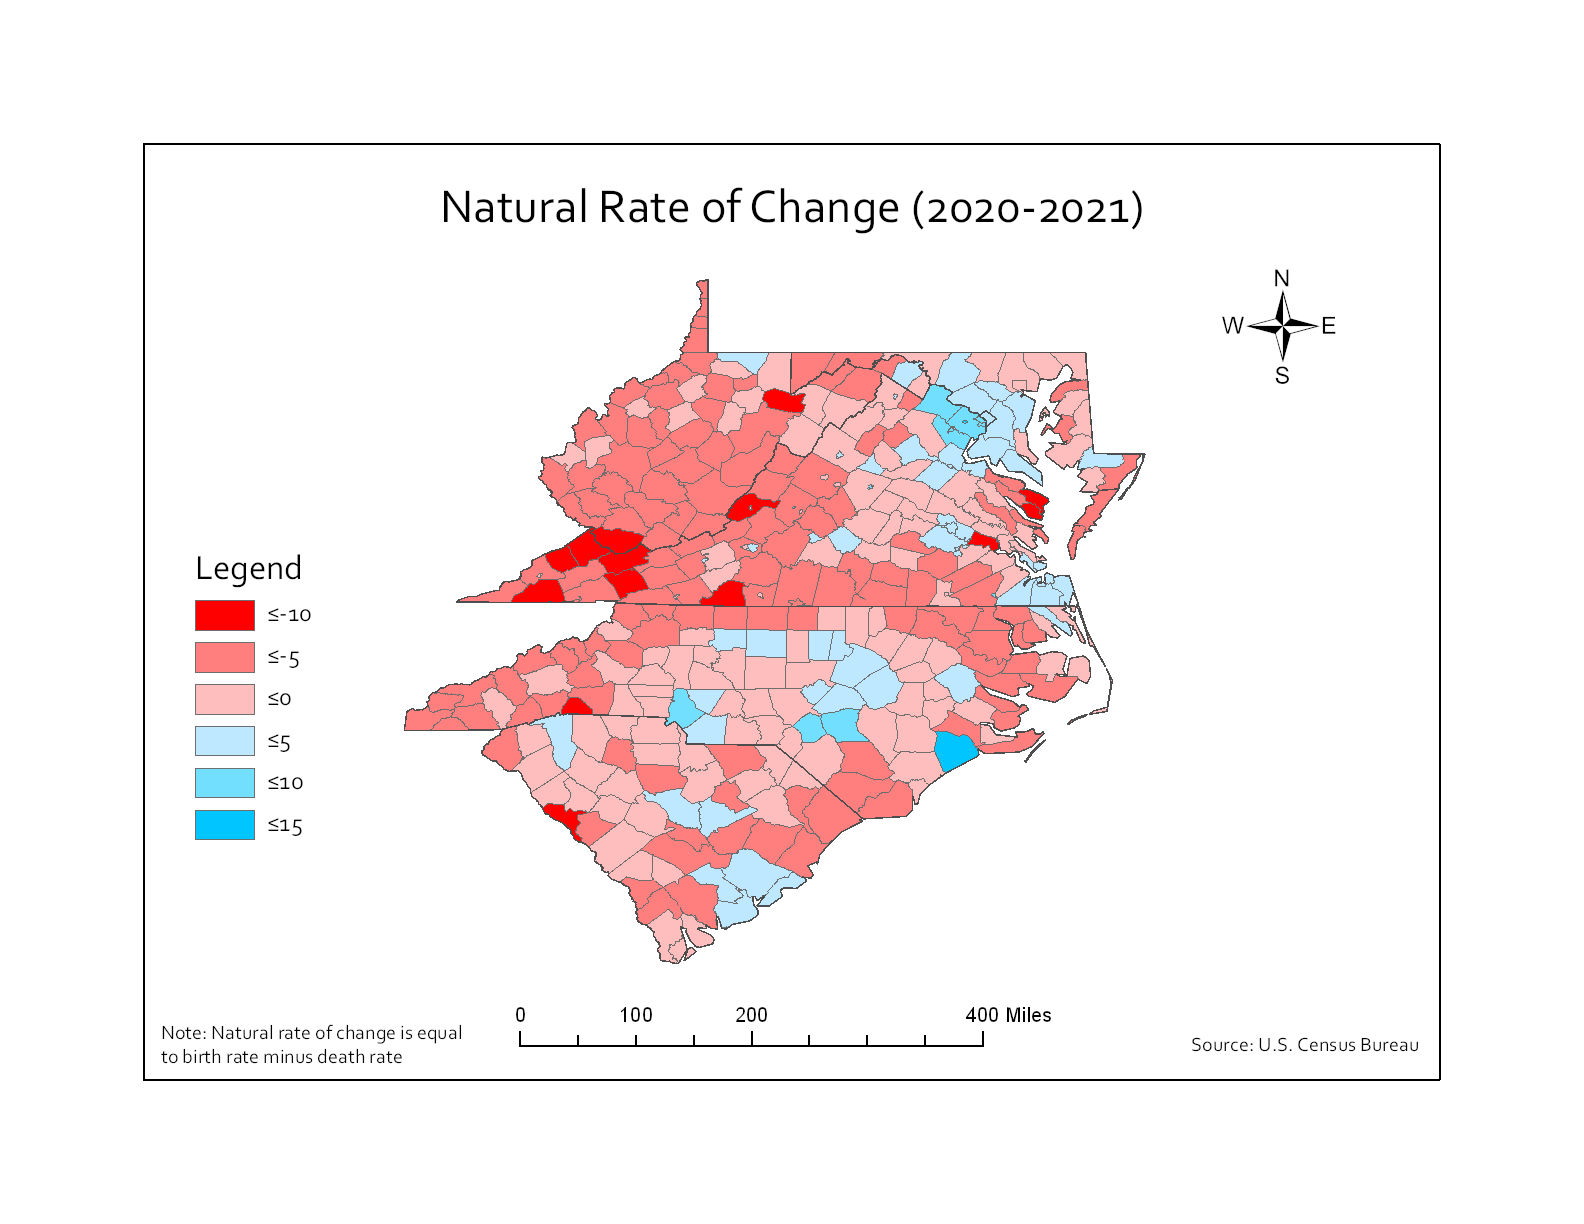
The map below shows the rate of natural change across the district at the county level. From 2020-2021, the majority of counties had a negative natural rate of change (red counties), meaning there were more deaths than births (290 negative counties vs. 75 positive counties). The county with the largest negative rate was Lancaster County, Virginia, (RUCC 9), at -15.7, meaning there was 15.7 net deaths per 1,000 residents. It was one of 14 counties with a natural rate of change less than -10. The counties shown in blue had a positive rate of natural change (more births than deaths). The county with the largest positive rate was Fairfax City, Virginia, (RUCC 1) at 14.0. It was one of two counties with a natural change rate greater than 10.
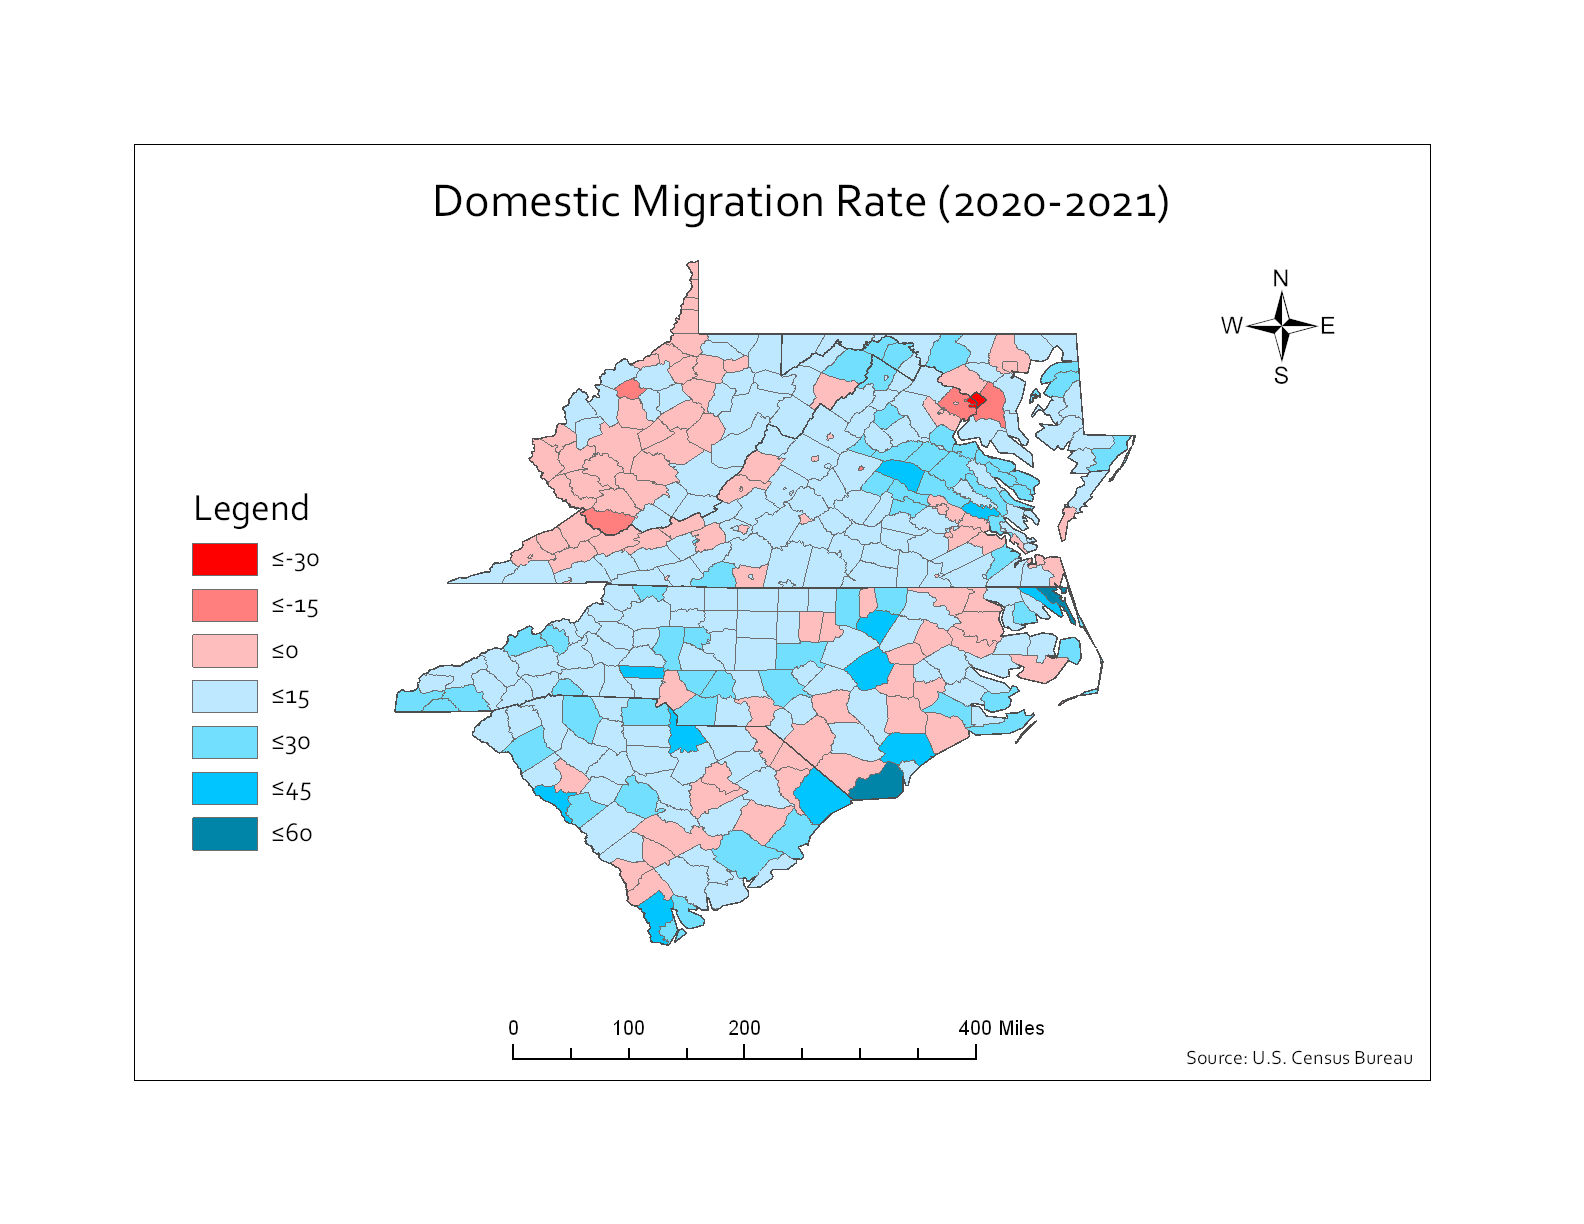
The domestic migration rate was positive in most counties (261 positive counties vs. 104 negative counties). The counties shown in red had a negative domestic migration rate (more people moved away than moved in). The county with the largest negative rate was Alexandria City, Virginia, (RUCC 1), at -39.4, meaning 39.4 people moved out of the city per 1,000 residents. The District of Columbia had the second largest negative migration rate (-33.9). There were 21 other counties with domestic migration rates less than -10. The counties shown in blue had a positive domestic migration rate (more people moved in than moved away). The county with the largest positive rate was Brunswick County, North Carolina, (RUCC 2 and home to Wilmington), at 53.4. There were four counties with a domestic migration rate greater than 40, and 115 other counties with a domestic migration rate greater than 10.
Since the COVID-19 pandemic began, populations across the United States and Fifth District have shifted across urban and rural areas. As pandemic conditions and work environments continue to evolve, we may continue to see changes in where people decide to live and work. The Census Bureau’s county-level population estimates for 2022 will be released in March 2023. These data will allow us to see if there is a continuation of these trends.