

Which articles do you read? What topics would you like to see more coverage of? Please take a few minutes to fill out the online survey.
Community Effects of Climate Change in North Carolina
According to a 2021 report by the World Meteorological Organization, hurricanes, floods, heat waves, and droughts have increased in frequency and intensity around the world, accounting for 2 million deaths and $3.64 trillion in losses globally between 1970 and 2019. In the mid-Atlantic region, these events typically result in river and coastal flooding; several recent examples have devastated communities.
"Climate Change and the Economy," Econ Focus, First Quarter 2022.
"Pricing and Mispricing of Climate Risks in U.S. Financial Markets," Economic Brief No. 21-41, December 2021.
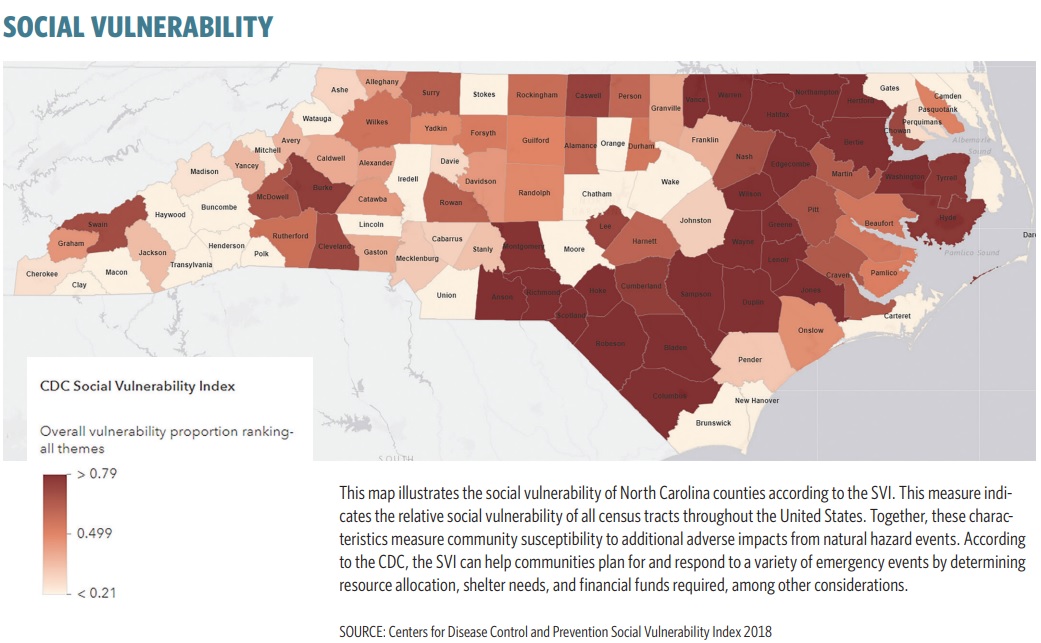
When considering a community's vulnerability to natural hazard events, one important factor is the community's social vulnerability. Social vulnerability has been defined by the Federal Emergency Management Agency (FEMA) as the susceptibility of social groups to the adverse effects of natural hazards, including disproportionate death, injury, loss, or disruption of livelihood. In this chart gallery, the term refers to the Centers for Disease Control and Prevention's (CDC) Social Vulnerability Index, or SVI, a measure that is derived from 15 characteristics across four categories: socioeconomic status, household composition/disability, minority status/language, and household type/access to transportation. This index can provide additional insight into which communities may suffer disproportionately following a natural hazard event. For more detail on the makeup of the SVI, see the table below.
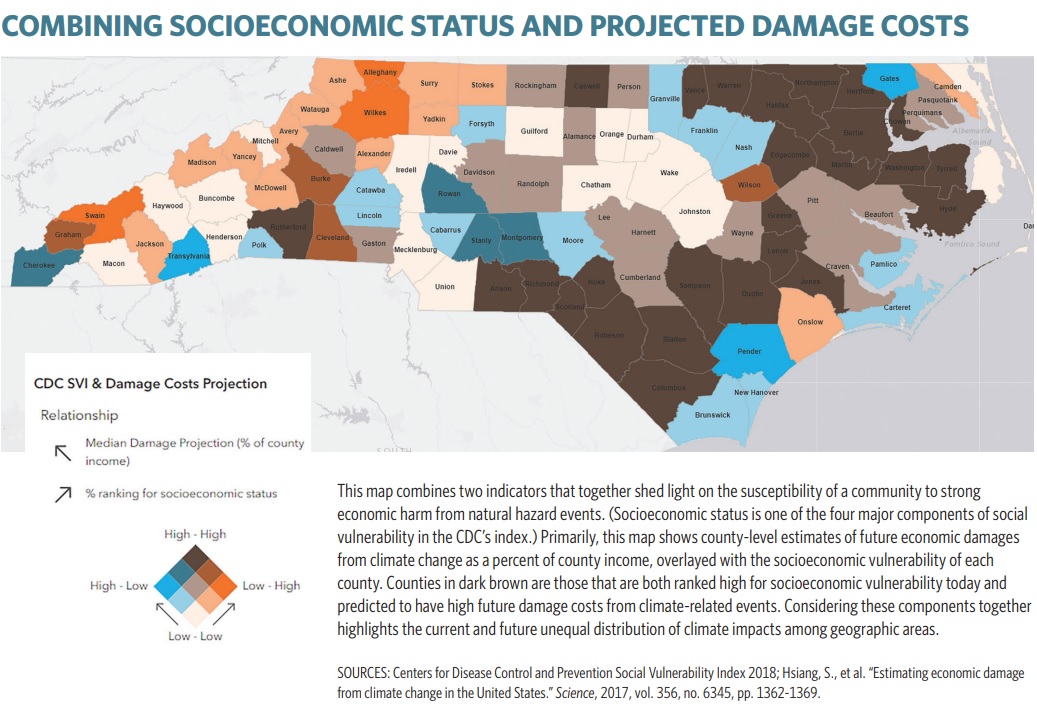
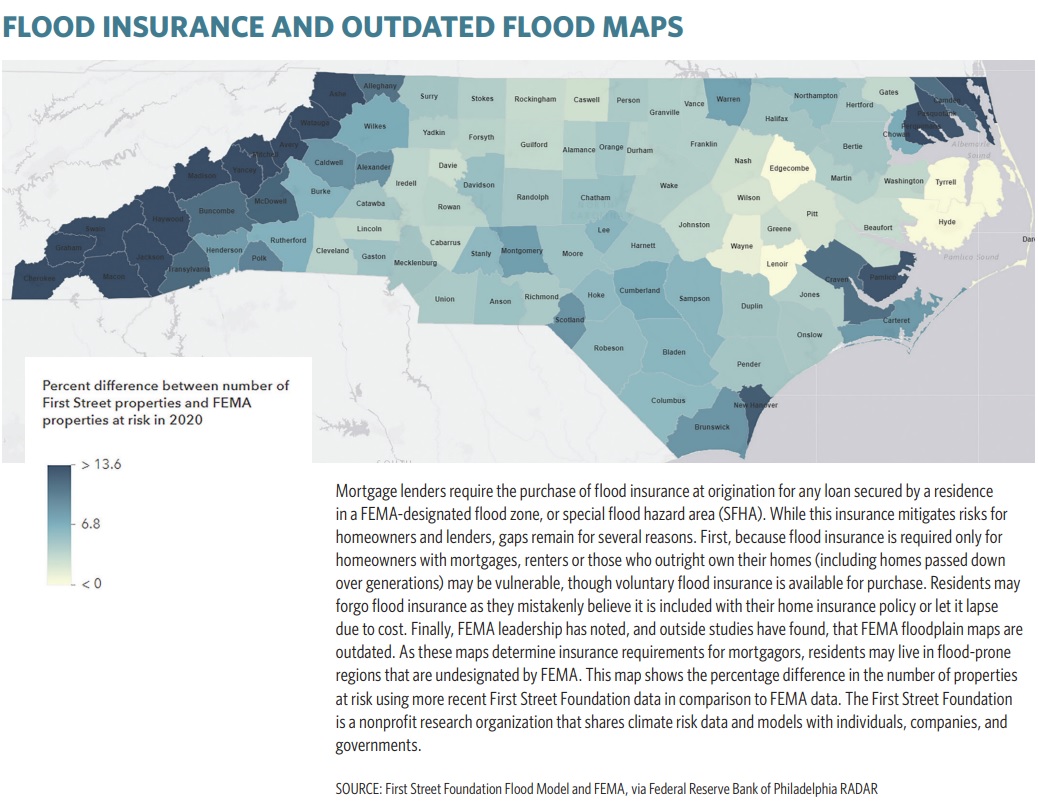
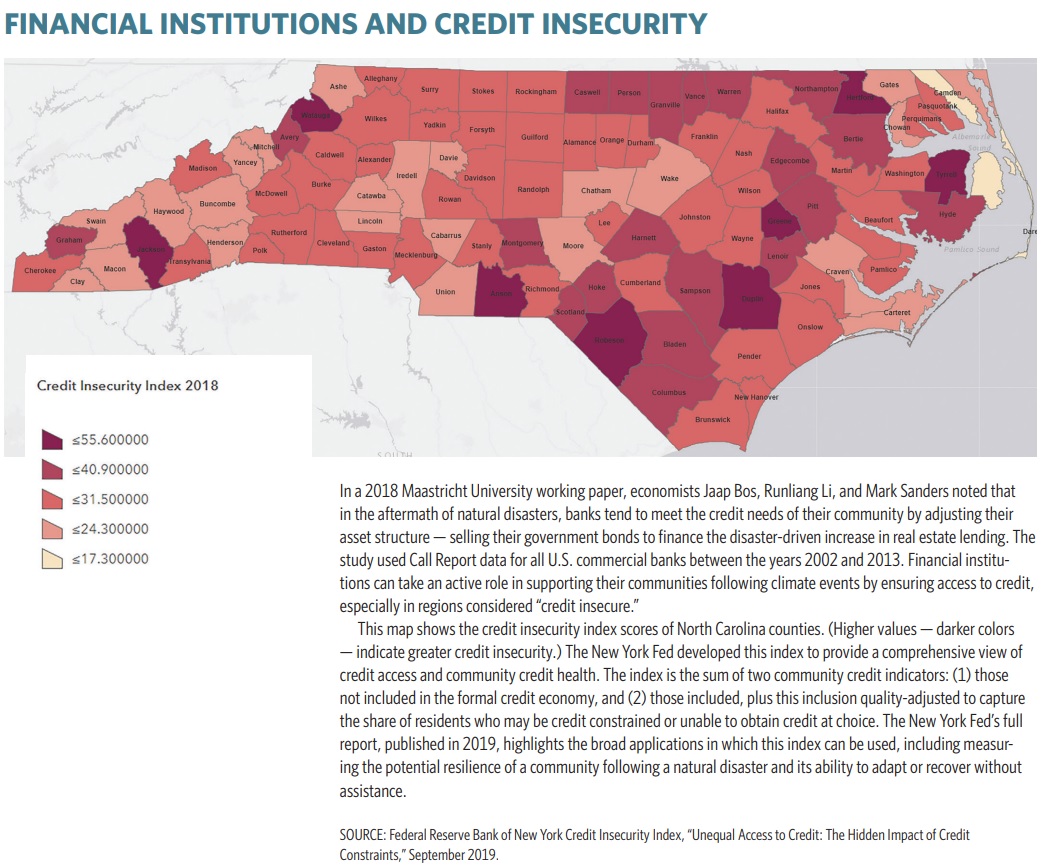
The following images are from a data-mapping exercise completed by analysts at the Richmond Fed to highlight the impact of flooding on communities within North Carolina through the lens of social vulnerability. The exercise showed the connection between counties with high levels of social vulnerability and those projected to face high costs from natural hazard events in the future. Because these events in North Carolina tend to be flood related, the role of flood insurance and coverage was a significant consideration for the exercise. Finally, counties with high levels of credit insecurity — that is, limited access to credit and poor credit health — tend to have high social vulnerability scores and may face difficulties recovering from a disaster. The mapping exercise highlights these counties and explores the role financial institutions play as suppliers of capital in these communities.
The complete interactive exercise, which contains additional information about flood risk mitigation, the effects of rising temperatures, and the role of financial institutions, can be viewed online.
| COMPONENTS OF SOCIAL VULNERABILITY INDEX | |||
|---|---|---|---|
| Socioeconomic Status | Household Composition and Disability | Minority Status and Language | Housing Type and Transportation |
|
|
|
|
READINGS
Bos, Jaap, Runliang Li, and Mark Sanders. "Hazardous Lending: The Impact of Natural Disasters on Banks' Asset Portfolio." Maastricht University Graduate School of Business and Economics GSBE Research Memoranda No. 021, Aug. 27, 2018.
Douris, James, and Geunhye Kim. "WMO Atlas of Mortality and Economic Losses from Weather, Climate, and Water Extremes (1970 - 2019)." World Meteorological Organization No. 1267, 2021.
Hamdani, Kausar, Claire Kramer Mills, Edison Reyes, and Jessica Battisto. "Unequal Access to Credit: The Hidden Impact of Credit Constraints." Federal Reserve Bank of New York, September 2019.
Helmore, Edward. "US flood maps outdated thanks to climate change, FEMA director says." The Guardian, Sept. 4, 2022.
Hsiang, Solomon, et al. "Estimating economic damage from climate change in the United States." Science, June 2017, vol. 356, no. 6345, pp. 1362-1369.
Receive an email notification when Econ Focus is posted online.
By submitting this form you agree to the Bank's Terms & Conditions and Privacy Notice.


