Lifetime Medical Spending of Retirees
Economic Brief
May 2019, No. 19-05
Retirees face considerable medical expenses during their remaining lives. Model simulations suggest that although a large amount of that spending can be predicted — based on attributes such as income, health, and marital status — there remains significant dispersion. Households with heads who turned seventy in 1992 will incur $122,000 in medical spending on average, including out-of-pocket expenditures and Medicaid payments. But the top 5 percent of households will incur more than $300,000 in such spending. The level and dispersion of this spending diminish only slowly with age.
Most elderly Americans face the risk of catastrophic health care expenses despite near universal enrollment in the Medicare program. There are many gaps in Medicare coverage, such as long hospital and nursing home stays. Moreover, Medicare requires copayments for many medical goods and services. Affluent individuals have reported being worried about rising health care costs more than any other financial issue.1
Although there is a large literature documenting annual medical spending at older ages, relatively little work has been done documenting cumulative lifetime spending, particularly the distribution of that spending. Yet in many ways, lifetime totals are most important to savings decisions and household well-being because forward-looking individuals base their consumption less on current income than on the average income they expect to receive over their lifetimes. The same logic applies to medical spending. Households care not only about the risk of catastrophic expenses in a single year, but also the risk of moderate but persistent expenses than can build into catastrophic lifetime costs.
In a recent paper, John Bailey Jones and Justin Kirschner of the Richmond Fed, Mariacristina De Nardi of the Minneapolis Fed, and Eric French and Rory McGee of University College London estimate the distribution of lifetime medical spending for retired households whose heads are seventy or older.2 They focus on out-of-pocket spending, but because high out-of-pocket expenses can leave households indigent and dependent on Medicaid, they also include Medicaid payments in their benchmark spending estimates. In accounting terms, the benchmark estimates measure the medical spending not covered by Medicare or supplemental private insurance, although they do include Medicare and supplemental private insurance premia. In economic terms, the benchmark estimates measure the medical spending risk that households of all wealth levels would face were Medicaid not available (absent any other changes in their insurance).
Data and Methodology
The authors use data from the Health and Retirement Study (HRS), which has high-quality information on out-of-pocket medical spending during the period 1995–2014. Because the HRS does not have Medicaid payment data, the authors impute Medicaid payments using the Medicare Current Beneficiary Survey. Ideally, these data would permit the authors to estimate medical spending directly by calculating discounted sums of household spending histories. But even though the HRS has a long panel dimension for a survey of its type, it is not long enough to track all seventy-year-olds through the ends of their lives. The authors employ models instead.
They combine two models in their analysis, both dynamic. The first is a model of health and mortality estimated from the HRS. The second is a model of medical spending (out-of-pocket and Medicaid) given health and household composition, estimated using the HRS and the medical spending measures described above. In addition to health and household composition, the second model allows medical spending to depend on age, permanent income (PI), and idiosyncratic shocks. Simulating the estimated models permits the construction of household histories, the calculation of discounted sums, and ultimately the distribution of lifetime medical spending.3
Results
Figure 1 below shows the implications of the authors' model for the cross-sectional distribution of their preferred medical spending measure, the sum of costs paid either out of pocket or by Medicaid, expressed in 2014 dollars. Mean expenditures are shown, along with the 50th, 90th, and 95th percentiles.
The top left graph summarizes the health care expenditures of surviving households in annual terms. Medical expenses rise rapidly with age. For example, mean medical spending rises from $5,100 per year at age seventy to $29,700 at age 100. At the upper tail, the 95th percentile increases from $13,400 to $111,200.
The top right graph shows annual end-of-life costs, including burial expenses. The results for age seventy-two describe the expenses incurred by households who die between ages seventy-two and seventy-four. On average, end-of-life medical expenses exceed those of survivors. Mean end-of-life expenses range from $11,000 at age seventy-two to $34,000 at age 100. For the 95th percentile, expenses range from $35,000 at age seventy-two to $114,000 at age 100.
The bottom graph plots the authors' variable of greatest interest, lifetime expenditures. At each age, they calculate the present discounted value of remaining medical expenditures from that age forward, using an annual real discount rate of 3 percent. The lifetime totals are considerable. At age seventy, households will, on average, incur more than $122,000 of medical expenditures during the remainder of their lives. The top 5 percent of spenders will incur expenses greater than $330,000. A noteworthy finding is that lifetime totals do not fall rapidly as households age and approach the ends of their lives, as one might expect. A couple at age ninety will, on average, spend more than $113,000 before they die. The 95th percentile of remaining lifetime spending is higher at age ninety than at age seventy. The slow decline of lifetime costs is due mostly to the tendency of medical costs to rise with age. Households that live to older ages have shorter remaining lives but higher annual expenditures.
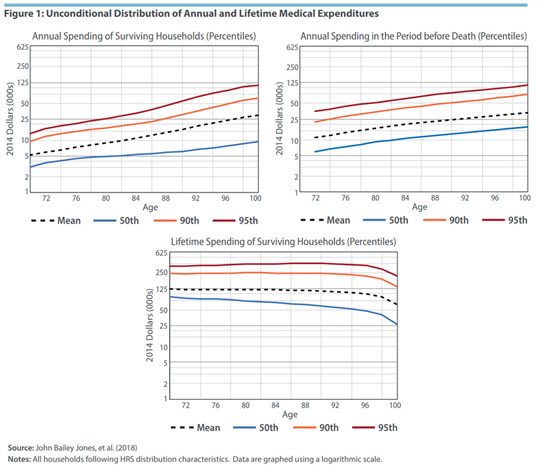
In total, the graphs in Figure 1 show that medical costs of older households are high, rise with age, and are widely dispersed.
Figures 2 and 3 show the means and 90th percentiles of lifetime medical expenses for different values of PI and initial health and marital status. Figure 2 shows the results for households at the very bottom of the income distribution (PI = 0). Lifetime spending varies greatly across the distribution of initial health and marital status. The following are some of the most apparent trends. First, women have higher lifetime medical expenditures than men. Second, people who are initially in good health have higher lifetime expenditures than those who are initially in bad health. This result is due to their longer life expectancies in combination with the tendency of medical costs to rise with age. Third, households in nursing homes have the highest lifetime expenditures, despite their high rates of mortality, because of the high cost of such care. Most people who are not in nursing homes at age seventy never have extended nursing home visits, however.
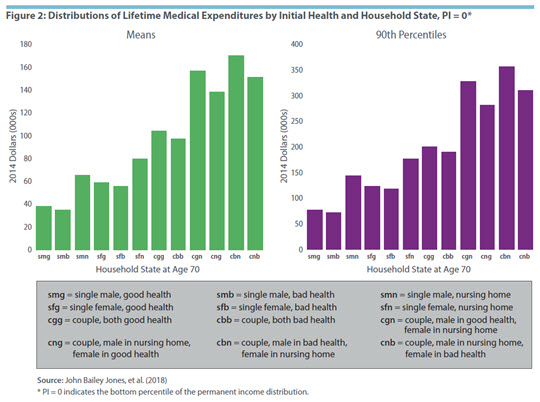
Figure 3 shows the results for households at the very top of the income distribution (PI = 1). These households spend considerably more than those at the bottom, shown in Figure 2, often well in excess of 50 percent more. For instance, consider a seventy-year-old couple with both members initially in good health and a PI rank of 0. That couple would, on average, spend $104,000 during their remaining lives. With a PI rank of 1, they would spend more than $165,000. Households with higher incomes may have higher lifetime expenditures because they live longer or because they have higher expenses at any given age.
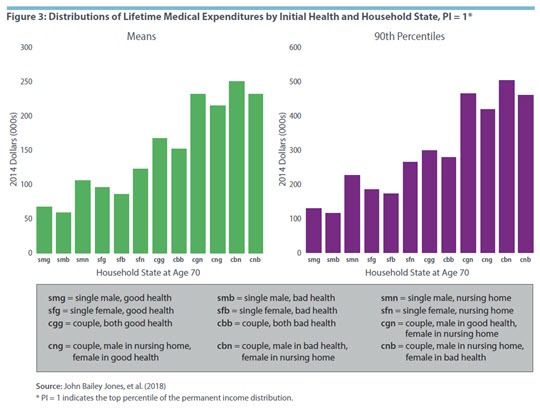
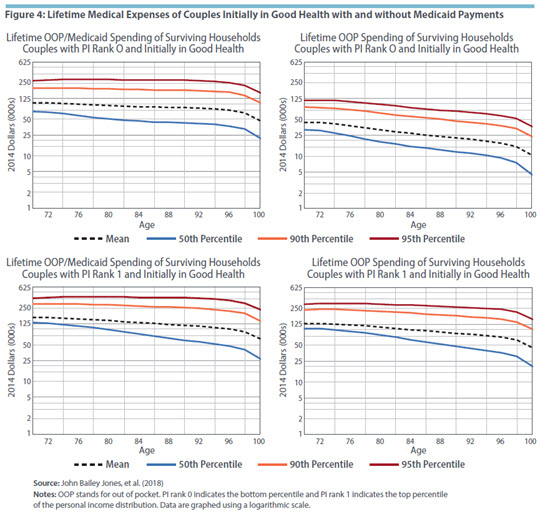
Figure 4 compares lifetime medical spending of couples in initial good health with and without Medicaid payments. The top two graphs show those at the bottom of the income distribution. Medicaid covers, on average, 57 percent of lifetime costs at age seventy. At older ages and higher spending percentiles it covers even more. The bottom two graphs show results for households at the top of the income distribution. Medicaid covers, on average, 21 percent of lifetime costs at age seventy and rises to nearly 30 percent at age 100. While most high-income households do not receive Medicaid, those that qualify do so under the "medically needy" provision, which assists households whose financial resources have been exhausted by medical expenses. Those households tend to have high medical expenses and tend to receive large Medicaid benefits.4
Discussion and Conclusions
The simulations by Jones, De Nardi, French, McGee, and Kirschner show that lifetime medical spending is high and uncertain — and that the level and dispersion of such spending diminish only slowly with age. Although permanent income, initial health, and initial marital status have large and predictable effects, much of the dispersion in lifetime spending is due to events at older ages. The poorest households have the majority of their medical expenses covered by Medicaid, which significantly reduces their spending volatility. Medicaid also reduces the level and volatility of medical spending for high-income households but to a much smaller extent.
The authors note a few caveats to their analysis. Their research assumes, as do many other empirical studies, that medical spending is exogenous when in fact it is a choice variable. Although the demand for some medical goods and services is extremely inelastic, the demand for others might be quite elastic. For instance, nursing home care is a bundle of medical and nonmedical commodities, and the latter can vary greatly in quality and type.
In addition, the authors' estimates are for the cohort that turned seventy in 1992. In the interim, medical spending has risen at every age. As a result, the estimates are lower than they would be if they had followed a more recent cohort.
Finally, their analysis excludes payments made by Medicare and private insurers. Medicare spending substantially reduces out-of-pocket medical expenses throughout the retiree population.5 While the combination of out-of-pocket and Medicaid expenditures considered by the authors may be sufficient for some analyses, such as studies of household saving, other analyses require that all health care costs be accounted for.
John Bailey Jones is a senior economist and research advisor and Aaron Steelman is director of publications in the Research Department at the Federal Reserve Bank of Richmond.
1
Merrill Lynch Wealth Management, "Merrill Lynch Affluent Insights Survey National Fact Sheet," February 2012.
2
John Bailey Jones, Mariacristina De Nardi, Eric French, Rory McGee, and Justin Kirschner, "The Lifetime Medical Spending of Retirees," Federal Reserve Bank of Richmond Economic Quarterly, Third Quarter 2018, vol. 104, no. 3, pp. 103–135.
3
The paper uses the model found in a paper titled "Couples' and Singles' Savings after Retirement" by De Nardi, French, Jones, and McGee. It is currently a work in progress. It builds on a previous paper by French and Jones, "On the Distribution and Dynamics of Health Care Costs," Journal of Applied Econometrics, November 2004, vol. 19, no. 6, pp. 705–721, as well as two papers by De Nardi, French, and Jones, "Why Do the Elderly Save? The Role of Medical Expenses," Journal of Political Economy, February 2010, vol. 118, no. 1, pp. 39–75, and "Medicaid Insurance in Old Age," American Economic Review, November 2016, vol. 106, no. 11, pp. 3480–3520.
4
See De Nardi, French, and Jones (2016).
5
See Silvia Helena Barcellos and Mireille Jacobson, "The Effects of Medicare on Medical Expenditure Risk and Financial Strain," American Economic Journal: Economic Policy, November 2015, vol. 7, no. 4, pp. 41–70.
This article may be photocopied or reprinted in its entirety. Please credit the authors, source, and the Federal Reserve Bank of Richmond and include the italicized statement below.
Views expressed in this article are those of the authors and not necessarily those of the Federal Reserve Bank of Richmond or the Federal Reserve System.
Subscribe to Economic Brief
Receive a notification when Economic Brief is posted online.
Contact Us