Should More Student Loan Borrowers Use Income-Driven Repayment Plans?
Economic Brief
June 2021, No. 21-20
The share of the U.S. population with a college degree is growing. So is the share of degree holders who took out federal student loans. Newer repayment options allow borrowers to adjust their payments based on their income. More education on available options may help borrowers navigate the system and choose the repayment plan that works best for them.
The educational attainment of the U.S. population has increased significantly. A quarter of those aged 25 and older had a bachelor's degree 20 years ago. That number now exceeds a third.1 The growth in attainment has been accompanied by an increase in borrowing to finance higher education: Nearly 62 percent of those who completed their bachelor's degrees in the 2015-2016 academic year took out federal student loans, compared to less than 53 percent in the 1999-2000 academic year.2 And these numbers don't include borrowers who failed to get degrees, leaving them with the costs of borrowing but without the benefits.
At present, student loans in the U.S. are not dischargeable in bankruptcy. That is, they must be repaid unless borrowers demonstrate "undue hardship." Nonetheless, in 2019, 11 percent of student loan debt was 90+ days delinquent or in default. The effective delinquency rate is likely higher, as a portion of the outstanding loans are in grace periods, deferment or forbearance.3
In this Economic Brief, we describe the relationship between earnings and student loan borrowing and repayment. We then discuss repayment options currently available, focusing on plans that base the amount repaid each month on the borrower's income.
Student Loan Borrowing and Repayment Patterns across Income Groups
The Survey of Consumer Finances (SCF) — a triennial, nationally representative survey of U.S. families carried out by the Federal Reserve Board — includes information on student loans held by families.4 In 1989, less than 10 percent of families surveyed by the SCF had a student loan on their balance sheet. By 2019, the share had increased to 21 percent. While most families with a student loan had only one, 30 percent had two or more loans.5
Not surprisingly, student loans are more common among younger families (those with heads of household between 18 and 39 years old): Around 40 percent held at least one student loan in 2019. However, a non-trivial share of families carry student loan balances well into middle age, sometimes simultaneously carrying balances on loans taken out for their own education and for their children's.6
In general, higher income households borrow more than lower income ones. (See Figure 1 below.)
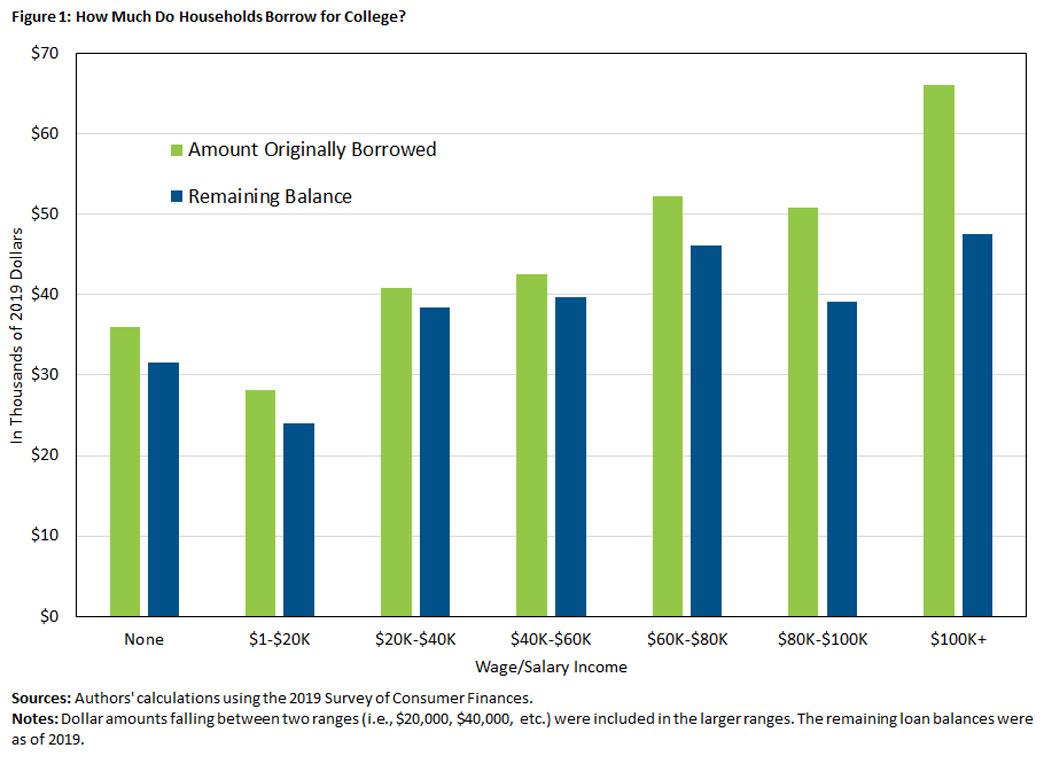
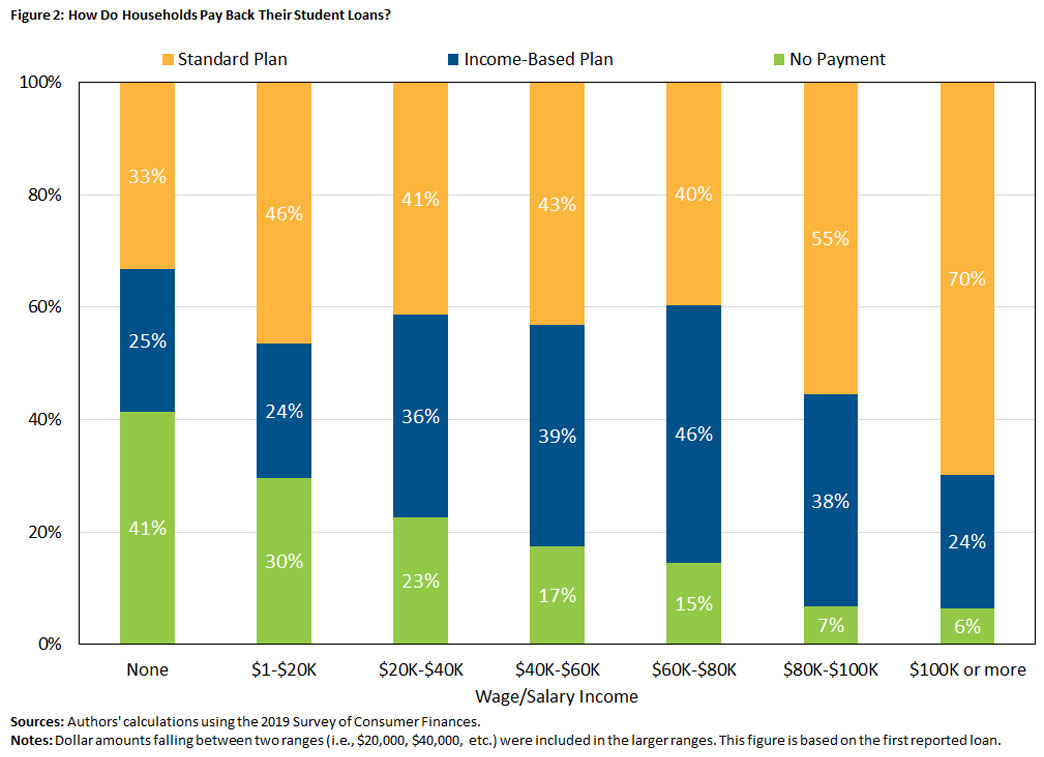
Families that earned over $100,000 originally borrowed in excess of $66,000. However, their remaining balances are comparable to those of families that earned less. This in part reflects life cycle effects, as families typically earn more as they age and are also further along in paying down their debts. However, it also reflects repayment challenges: Over 40 percent of the lowest earning families were not making payments on their student loans, compared to only 6 percent of the highest earners.7 (See Figure 2 below.) Nonrepayment is noteworthy given that only limited options exist for the discharge or forgiveness of student loan debt.
Student Loan Repayment Options
When borrowers enter repayment of federal student loans, they can choose from several repayment options.8 The standard repayment plan is a 10-year, fixed payment plan. If borrowers do not select another repayment option, they will be automatically enrolled in the standard plan. Graduated and extended repayment plan options are also available for eligible borrowers.
In addition to these traditional plans, there are four income-driven repayment (IDR) plan options that allow eligible borrowers to adjust monthly payments in response to changes in their discretionary income.9 For some of the IDR plans, the required monthly payment is capped at the amount a borrower would need to pay under the standard repayment plan.
For all the IDR plans, there is no penalty for paying more than the required amount. As such, these plans can potentially provide borrowers with the ability to adjust payments if their earnings turn out to be different (higher or lower) than expected. If a borrower on an IDR plan has not repaid their loan balance at the end of the repayment period (either 20 or 25 years), their outstanding balance will be forgiven.10 However, it should be noted that the total amount repaid over the life of the loan may be higher under IDR plans than under the standard plan, and borrowers may be required to pay taxes on any amount forgiven.
Why Aren't IDR Plans Used More?
According to a Congressional Budget Office report, enrollment in IDR plans grew significantly from 10 percent of borrowers in 2010 to 27 percent of borrowers in 2017.11 The percentage of loan balances being repaid through IDR plans increased even more, from 12 percent to 45 percent, over the same period.
The difference between the percentage of borrowers choosing IDR plans and the percentage of loan balances being repaid through IDR plans indicates that the borrowers opting for IDR plans have relatively high loan balances. Some of that difference can be explained by graduate borrowers (who tend to have higher student loan balances) being more likely to opt into IDR plans than undergraduate borrowers. As of 2017, only 24 percent of undergraduate borrowers had opted into IDR plans compared to 39 percent of graduate borrowers, and 56 percent of graduate loan balances were being repaid through IDR plans compared to 34 percent of undergraduate loan balances.
In addition, IDR plans are most popular among middle-income households, as seen in Figure 2. The fact that there isn't greater take-up of IDR plans amongst the lowest income households is somewhat surprising given that their monthly payments could be lower or even zero under IDR plans.
Data indicate that borrowers in IDR plans are much less likely to default on their loans than borrowers in standard fixed-payment plans. A Congressional Budget Office analysis shows that, in 2017, the cumulative default rate of undergraduate borrowers who began repayment in 2012 was over 30 percent for those on standard plans compared to less than 20 percent for borrowers on IDR plans.12 The same pattern holds for graduate borrowers, although their default rates are much lower on both plans than default rates for undergraduate borrowers. If IDR plans appear to provide greater protection against default, why do we not see more borrowers switching to these plans?
The current repayment system in the U.S. rests on the idea that borrowers will optimally choose a repayment plan based on their unique circumstances. But calculating costs and benefits of different plans — and doing so under uncertainty — is undoubtedly difficult. Borrowers could benefit from straightforward information and tools to help them evaluate their choices.
A noteworthy deterrent to enrollment in IDR plans could be the tendency of borrowers to stick with the plan in which they are initially enrolled. A recent experiment found that changing the default plan to an IDR plan leads to a significant decline in using the standard plan: a near 30 percentage point decline.13 The researchers further find that, when adding earnings information to help borrowers grasp the distribution of college graduates' labor market outcomes, it amplified the effect of changing the default option to an IDR plan. The combination of these factors reduced take-up of the standard plan by nearly 46 percentage points.
Lessons from Other Countries
It's also possible that loan features and administrative burdens deter eligible borrowers from enrolling in IDR plans. Other countries have widely adopted income-based repayment for student loans. For example, Australia and England both have universal income-contingent loan (ICL) systems in which loan repayments for all borrowers are based on income.
While direct comparison is difficult because borrowers in those countries are automatically enrolled in ICL plans (unlike in the U.S. where they have a choice), there may be features that make these plans more attractive. For example, loan payments in Australia and England are based on a borrower's current income, unlike in the U.S. where they are based on the borrower's previous income (that is, income they last reported). This may dampen the protection that IDR provides against income fluctuations, given that labor market outcomes can change quickly.
Furthermore, student loan repayment in Australia and England is linked administratively to tax collection. Payments are automatically adjusted to changes in income and withheld by employers or otherwise collected by tax authorities. By contrast, borrowers in the U.S. must take action to recertify their income annually for an IDR plan. This administrative burden may limit continued uptake of IDR plans for eligible borrowers.
Conclusion
Several reforms to student loans and repayment are currently being considered and debated in the public domain. How the system changes remains to be seen and depends on how policymakers view the relative importance of different goals, including:
- Protection against income fluctuations for borrowers
- Progressivity of loan repayment and forgiveness across the earnings spectrum
- The extent to which taxpayers subsidize student loan repayment
In particular, if the goal is to reduce delinquency and default, then educating borrowers and reducing administrative burdens may be helpful. Such efforts could be especially critical in the coming months as COVID-19 emergency relief for student loan borrowers is set to expire on Sept. 30, at which time borrowers will be required to resume payments.
Sarah Gunn and Nick Haltom lead the Economic Education and Regional and Community Analysis teams, respectively, and Urvi Neelakantan is a senior policy economist in the Research Department at the Federal Reserve Bank of Richmond.
1
"Rate of High School Completion and Bachelor’s Degree Attainment among Persons Age 25 and Over," National Center for Education Statistics, Digest of Education Statistics, 2019.
2
"Fast Facts," National Center for Education Statistics, Accessed June 22, 2021. The vast majority of student loans are now federal loans. Private loans make up only 7 percent of outstanding loan balances.
3
"Quarterly Report on Household Debt and Credit: 2019:Q4 (PDF)." Federal Reserve Bank of New York, Center for Microeconomic Data, February 2020.
4
Statistics and figures in this Economic Brief that use the SCF are based on the authors' calculations. All SCF figures are in 2019 dollars. For more detailed information on student loan borrowing and repayment decisions, which includes additional analysis of SCF data, see Athreya et al (forthcoming).
5
This can include everything from multiple loans taken out for one individual's study to different loans taken out for the education of different family members.
6
We find that 17 percent of families in which the survey respondent was between 50 and 59 years old carried student loan balances in 2019. Over half of these families were carrying balances on loans taken out for their own education, 38 percent on loans taken out for their children, and 9 percent had balances both on loans taken out for themselves and for their children.
7
This figure uses data on the families' first reported loan. "Standard plan" includes those who are not yet making payments because they are still enrolled in the program of study or are in the post-graduation grace period.
8
For descriptions of the various repayment plans available, see the U.S. Department of Education's webpage "Choose the Federal Student Loan Repayment Plan that's Best for You."
9
Depending on the IDR plan, discretionary income is defined as income above 150 percent or 100 percent of the federal poverty guideline.
10
Some borrowers may also be eligible to have a portion of their student loan balances forgiven earlier if they pursue careers in public service or as classroom teachers. The Public Service Loan Forgiveness Program forgives borrowers' remaining student loan balances after 10 years of qualified payments while being employed by the government, non-profit organizations or other qualifying employers. The Teacher Loan Forgiveness Program will forgive up to $17,500 of student loans for teachers who teach five consecutive, academic years at low-income schools.
11
"Income-Driven Repayment Plans for Student Loans: Budgetary Costs and Policy Options," Congressional Budget Office, February 2020.
12
"Income-Driven Repayment Plans for Student Loans: Budgetary Costs and Policy Options," Congressional Budget Office, February 2020.
13
James C. Cox, Daniel Kreisman and Susan Dynarski, "Designed to Fail: Effects of the Default Option and Information Complexity on Student Loan Repayment," Journal of Public Economics, December 2020, Vol. 92.
This article may be photocopied or reprinted in its entirety. Please credit the authors, source, and the Federal Reserve Bank of Richmond and include the italicized statement below.
Views expressed in this article are those of the authors and not necessarily those of the Federal Reserve Bank of Richmond or the Federal Reserve System.
Subscribe to Economic Brief
Receive a notification when Economic Brief is posted online.
Contact Us