How Do Firms Choose Where to Place Establishments?
Economic Brief
October 2021, No. 21-34
This Economic Brief presents different considerations faced by firms when organizing their operations across space. Following a recent research paper, it explains why large firms tend to have a larger presence in high-density locations than smaller firms, while the opposite is true in low-density locations.
How do firms decide where to set up locations? On one hand, it's costly to deliver goods to customers, so firms may want to be as close to customers as possible. On the other hand, concerns over cannibalization as well as the cost of managing a large amount of establishments restrict how close the firm can get to its customers.
My (Nicholas) recent working paper "Plants in Space" — co-authored with Ezra Oberfield, Esteban Rossi-Hansberg and Pierre-Daniel Sarte — finds that firms sort across space: Firms with high productivity place more establishments in dense locations and fewer establishments in low-density locations. Conversely, firms with low productivity place more establishments in low-density locations and fewer in higher-density locations.
The paper provides examples of the way spatial characteristics affect firms' decisions. The first example (Figure 1) shows Starbucks locations in Princeton, N.J., Richmond, Va., and New York in 2014. Each square represents a 12-square-mile area.
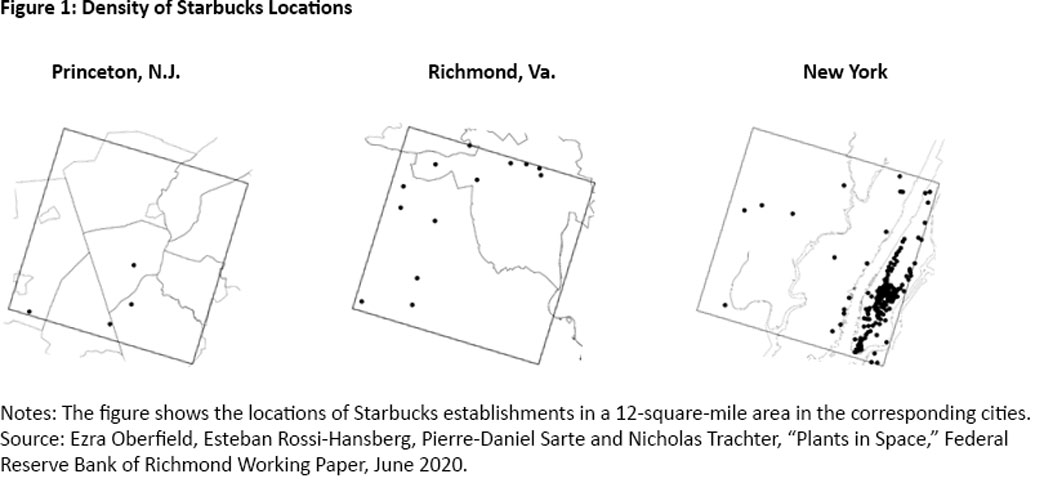
We can see not only that the number of stores varies greatly across locations, but also that the distance between stores in each location also greatly varies.
Another example comes from the distribution of Walgreens and Rite Aid stores in 2014. Walgreens — the bigger (and presumably more productive) firm — has more establishments than Rite Aid in areas with high population density, while Rite Aid has more establishments than Walgreens in areas with low population density.
Modeling Optimal Firm Locations
The model in the paper covers consumers, developers and firms. In this article, we'll focus on the problem of the firm, specifically where firms choose to locate.
Our model assumes that firms are heterogeneous in their innate productivity, but that locations differ in their productivity advantage and the level of local demand, and that shipping goods between two locations entails an "iceberg cost."1 Firms must also:
- Choose how many establishments to open and where to locate them
- Pay the commercial rental rate in each location where it opens an establishment
- Decide how many workers to hire in each establishment
- Decide which establishment will ship goods to each location to serve the local demand
Firms also face a span of control cost, where the effective productivity of the firm depends negatively on the total number of establishments that the firm operates. This allows us to capture the idea that it is more difficult to manage many establishments than a few of them.
Given the presence of iceberg costs, firms would like to set up multiple establishments to be as close to demand as possible. But many establishments entail large setup and span of control costs. These two costs — together with cannibalization concerns across the establishments owned by the firm — counterbalance the strong incentives faced by the firm to set up a multitude of production units across space.
Solving the problem of where firms should locate is complex. Namely, figuring out the level of demand that an establishment will face entails figuring out the level of demand of all other potential establishments owned by the firm. To address this issue, we use a limiting case of the model economy, which preserves all the relevant elements and trade-offs in the model discussed above. In the limit studied in the paper, the firm chooses a measure of plants to open in each location, instead of making the individual decision of whether to open an establishment in one point in space or not.
What Our Model Says
A strong implication of the model is that firms sort across space. Consider firms 1 and 2, where firm 1 has higher productivity than firm 2. Theoretically, there's a cutoff rent where firm 2 will place more establishments than firm 1 in locations below that rent, and firm 1 will place more establishments than firm 2 in locations above that rent.2
One important consideration is that firm 1 is also bigger than firm 2 and can place more establishments: At a basic level, if it is optimal for firm 2 to place N2 establishments, firm 1 can always do better and thus N1 > N2. Similarly, because firm 1 is more productive, it will hire more workers and, thus, be bigger. Finally, firm 1 also faces a higher marginal span of control cost than firm 2 due to having more establishments.
When considering how many establishments to open in a location, firms attempt to equate the gains from opening the establishments with the costs. The cost of opening an extra establishment in a location is equal to the sum of the direct cost of opening the establishment (measured by rent) and the firm's marginal span of control cost.
While firms 1 and 2 face the same rental cost at a location, firm 1 has a higher marginal span of control cost as noted earlier. An implication is that firm 1 is less sensitive to rent than firm 2. As a result, firm 1 places more establishments in high rent and high population density locations than firm 2. The fact that firm 2 places more establishments than firm 1 in low rent and low population density locations follows from span of control: High productivity firms can economize on span of control costs by placing few plants, or no plants, in these locations.
Empirical Evidence of Sorting
We test the sorting predictions using 2014 data from the National Establishment Time Series (NETS) dataset that provides considerable information on firms:
- All of their establishments' locations
- Their level of employment
- Their parent firm
While firm productivity is not observable, theory provides that it is possible to proxy productivity with the firm employment level.
To study sorting, we portion the continental U.S. into squares with side length of M miles, which allows us to study how firms set up their establishments across these squares. To test the predictions, we focus on employment density.3
Is it the case that bigger, more productive firms sort towards high-density locations? To study this, we compute for each firm the average employment density of the squares where it places establishments. Each employment density in the average is weighted by the number of establishments that the firm placed in each square. Then, because different industries may have different configurations of plants across space, we remove an industry fixed effect from the average computed for each firm.
Figure 2 below shows that, as predicted by the theory, there is a strong increasing relationship between the size of the firm and the average employment density of locations where the firm sets up its operations. And, as the figure shows, the result holds for different sizes of the squares.
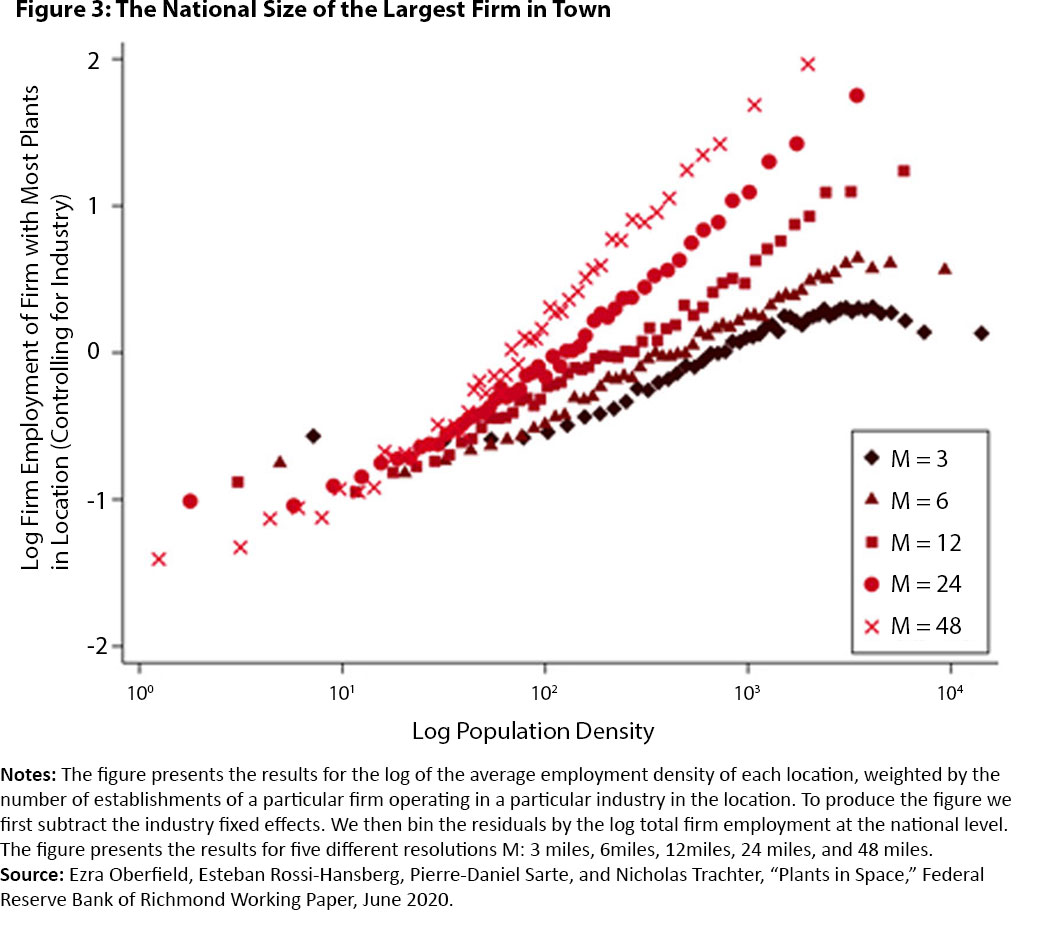
Do smaller firms place more establishments in low-density locations than bigger firms? One way to study this empirically is to see whether the national size of the firm with the most establishments in a location increases with the employment density of the location. If large firms were to also dominate in low-density locations, we should see a flat profile instead of an increasing profile.
Figure 3 presents this analysis, with industry fixed effects removed as was done previously. As the figure shows, for all square sizes, the national size of the firm with most establishments in a location increases with the employment density of the location.
Conclusion
This article shows that high-productivity firms place more establishments in high-density locations than low productivity firms, and that the opposite is true in low density locations. This result has interesting implications.
First, this sorting pattern helps to explain why some locations (counties, cities, etc.) are more productive than others: Because high-productivity firms place more establishments in high-density locations than low-productivity firms, high-density locations exhibit higher productivity than low-density locations.
Second, the sorting pattern has important implications for what may happen after an improvement in information and communication technologies, or ICT. Through the lens of the model, an improvement in ICT reduces the span of control cost for firms. This cost reduction induces highly productive firms to place more establishments in locations with low population density, pushing lower-productivity firms to shrink their operations and, in some cases, to exit the market.
Samira Gholami is a research analyst and Nicholas Trachter is a senior economist and research advisor in the Research Department at the Federal Reserve Bank of Richmond.
1
An iceberg cost implies that if a unit of a good should arrive at location X from location Y, a firm should ship more than one unit from Y. In other words, a fraction of the produced good melts in the process of shipping it from Y to X.
2
Because, in equilibrium, rent is higher in denser locations, the result also implies that firms sort in terms of population density.
3
This is used instead of the rental rate in a location due to data availability.
This article may be photocopied or reprinted in its entirety. Please credit the authors, source, and the Federal Reserve Bank of Richmond and include the italicized statement below.
Views expressed in this article are those of the authors and not necessarily those of the Federal Reserve Bank of Richmond or the Federal Reserve System.
Subscribe to Economic Brief
Receive a notification when Economic Brief is posted online.
Contact Us